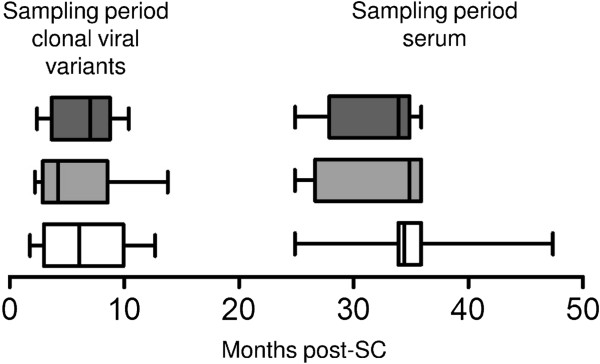
Figure 1.

Sampling of viruses and sera. Time bars showing the period in which viruses were isolated and the period in which sera were obtained for assessment of neutralizing activity. The white, grey and dark grey bars represent the individuals with non-CrNA (n=9), intermediate CrNA (n=10) and CrNA (n=12), respectively. The x-axis represents the months post-SC. The box-plots represent the sampling periods with minimum and maximum time points indicated by whiskers. The median time points of virus and sera sampling for the 31 individuals are indicated by solid vertical lines in the boxes.
