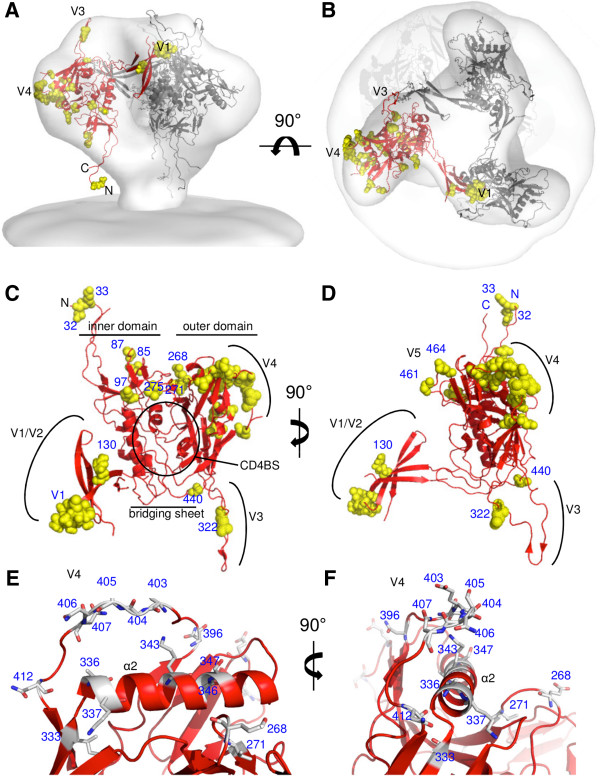
Figure 4.
Three dimensional clustering of amino acid positions that differ between individuals that induce CrNA and those that do not. Side (A) and top (B) views of the Env spike. The structures of three gp120 protomers, including the entire gp120 sequence and modeled as described in the Methods section, were fitted into the cry-EM density of the virus-associated Env spike [87]. A backbone trace of one protomer is colored in red and the positions revealed by SH are indicated in yellow space filling in the same protomer. (C, D). Model of gp120 with the same color-code as in A and B. Various Env subdomains are indicated in black font. Residues identified by SH are labeled in blue. The views are from the approach of CD4 (C) or rotated by 90° over the y-axis (D). The viral membrane would be at the top and the target membrane at the bottom. (E, F). Details of the V4 domain and its association with the α2 helix of the C3 domain. The residues identified by SH are indicated in sticks.

