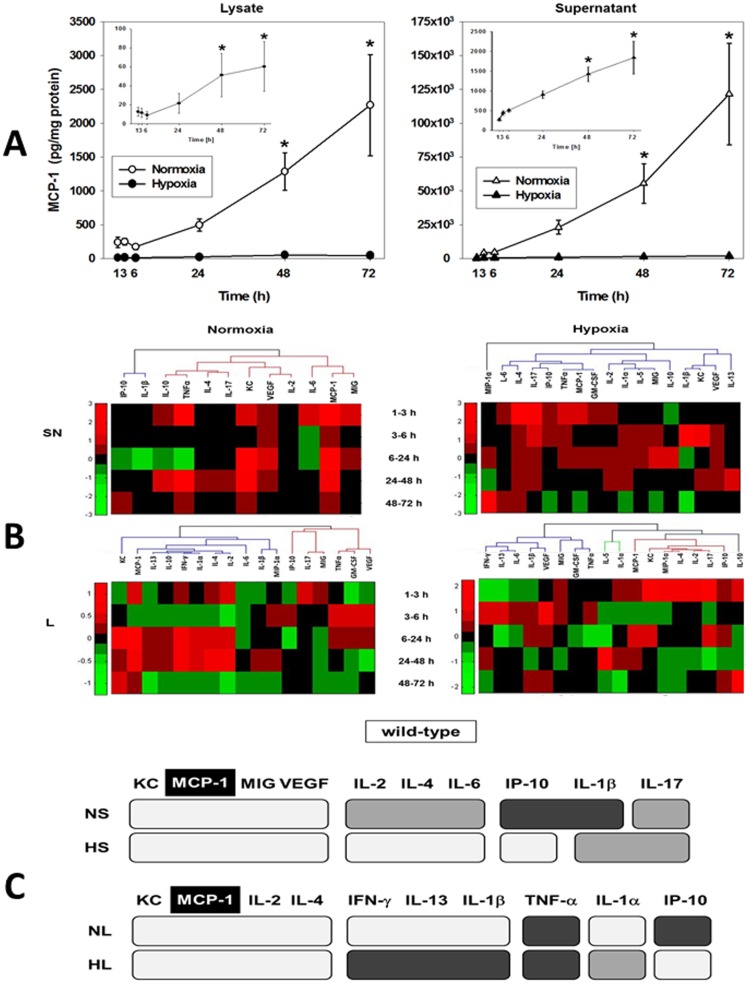
Figure 1. Inflammatory mediator production by primary mouse hepatocytes and meta-clustering analysis.
Freshly isolated hepatocytes from C57BL/6 (wild-type) mice were cultured under normoxic (control, 21% O2, open symbols) or hypoxic (1% O2, closed symbols) conditions for 1–72 h as described in the Materials and Methods . Both lysates and supernatants were assayed for 18 mouse inflammatory mediators using the Luminex xMAP technology and the measurements were normalized for protein content as indicated. (A) MCP-1 expression and release in primary mouse hepatocytes (mean ± SEM, n = 4–8 independent experiments, analyzed by Two-Way ANOVA followed by the Holm-Sidak post-hoc test, *P<0.001, normoxia vs. hypoxia within a specific time point). The insets show the levels of MCP-1 in hypoxia samples. (B) Hierarchical clustering over fold changes in wild-type hepatocytes (normoxia vs. hypoxia): Fold change values for each inflammatory mediator are represented in heat maps, ranging from large negative (green) to large positive values (red). No changes (zero values) changes are represented in black (see Materials and Methods ). (C) Comparison between meta-clustering analysis outcomes in normoxia and hypoxia (see Materials and Methods ). The shading of the boxes indicates the grouping of mediators that exhibited the same segregation pattern across all methods. For each experimental condition (NL, HL, NS and HS), only the mediators appearing in each consensus are shown. For comparison between experimental conditions only mediators common to both consensuses are shown. The consensus clusters characterize the cellular response and were derived from hierarchical clustering (mediators with similar dynamic trajectories) and from PCA (mediators with the strongest covariance with other mediators).

