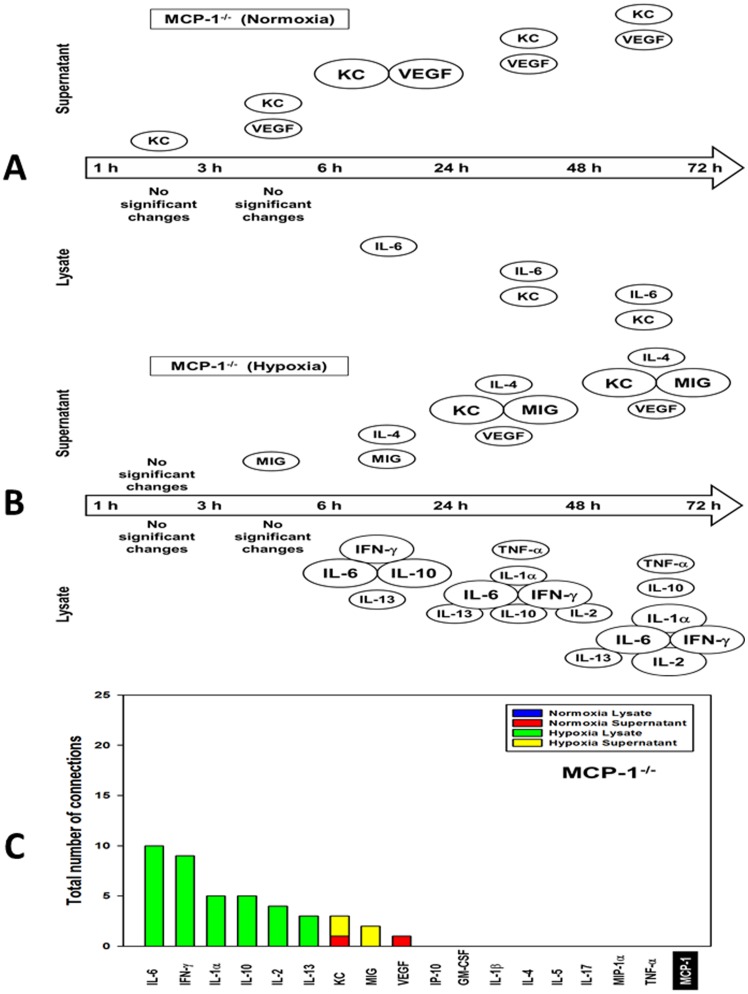
Figure 4. Dynamic Network Analysis (DyNA) of inflammatory mediators produced by normoxic and hypoxic mouse hepatocytes isolated from MCP-1−/− mice.
Primary hepatocytes isolated from MCP-1−/− mice were cultured under normoxic or hypoxic conditions (1–72 h) followed by measurement of inflammatory mediators in both lysates and supernatants as described in the Materials and Methods . After data normalization, DyNA was performed for both lysates and supernatants during each of the following five time frames: 1–3 h, 3–6 h, 6–24 h, 24–48 h, and 48–72 h as indicated. Panels show a summary of the DyNAs representing the principal inflammatory mediator “nodes” for both normoxia (A) and hypoxia (B) lysates and supernatants. (C) Stacked bars representing the total number of connections for each inflammatory mediator over all time intervals.

