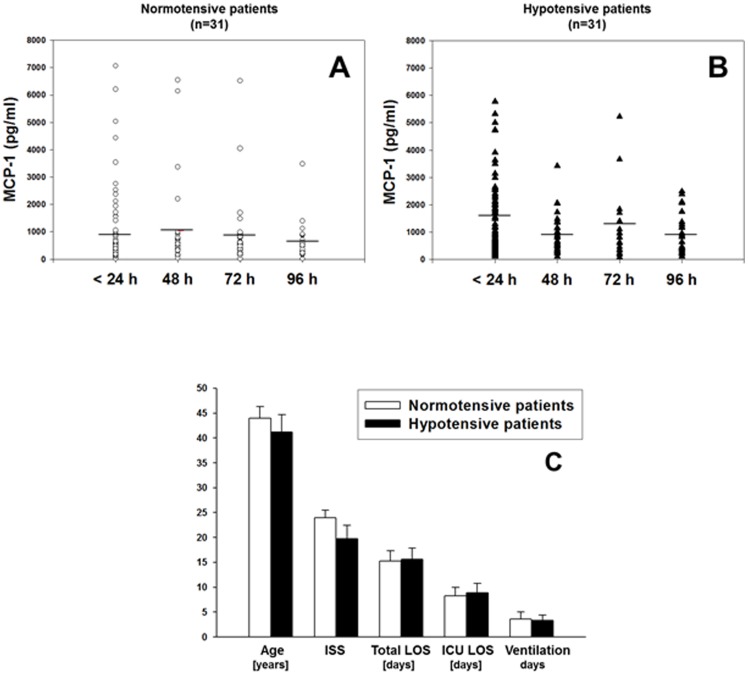
Figure 8. Plasma MCP-1 levels in blood samples from trauma patients.
Plasma MCP-1 levels in blood samples from normotensive (Panel A) and hypotensive (Panel B) trauma patients (n = 31 each as in Fig. 7 Panels B–C). Panel C shows the overall demographics of the normotensive (n = 27) and hypotensive patients (n = 19) segregated according to plasma MCP-1 levels (<1000 pg/ml and >1500 pg/ml) and blood pressure status. Results represent the mean ± SEM.

