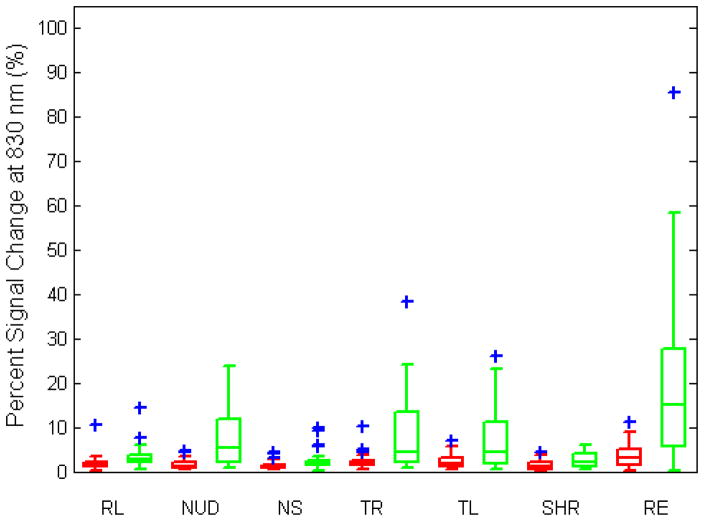
Fig. 6.
Percent signal change during motion artifact averaged over trials for collodion-fixed probes (red) and Velcro-probes (green) at 690 and 830 nm wavelengths. The central line shows the median, the edges of the box are the 25th and 75th percentiles and the blue plus signs are outliers. (RL: reading loudly, NUD: nodding up and down, NS: nodding sideways, TR: twisting right, TL: twisting left, SHR: shaking head rapidly, RE: raising eyebrows.)


