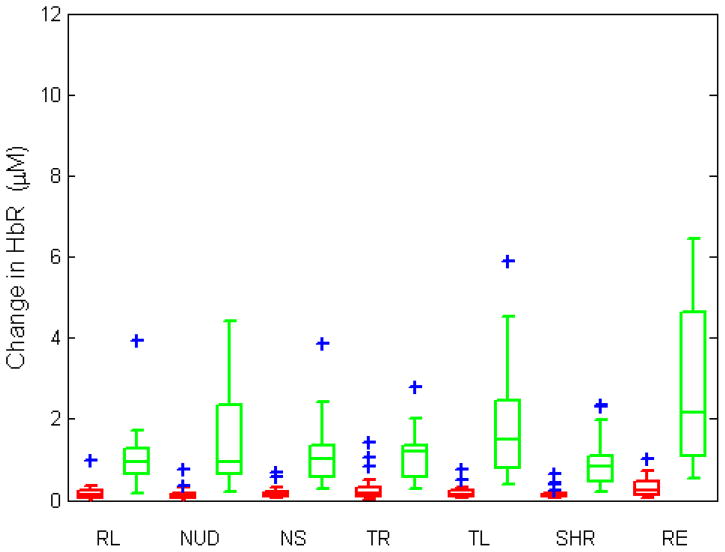
Fig. 7.
Changes in HbO and HbR (in molars) during motion artifact averaged over trials for collodion-fixed probes (red) and Velcro-probes (green). The central line shows the median, the edges of the box are the 25th and 75th percentiles and the blue plus signs are outliers. (RL: reading loudly, NUD: nodding up and down, NS: nodding sideways, TR: twisting right, TL: twisting left, SHR: shaking head rapidly, RE: raising eyebrows.)


