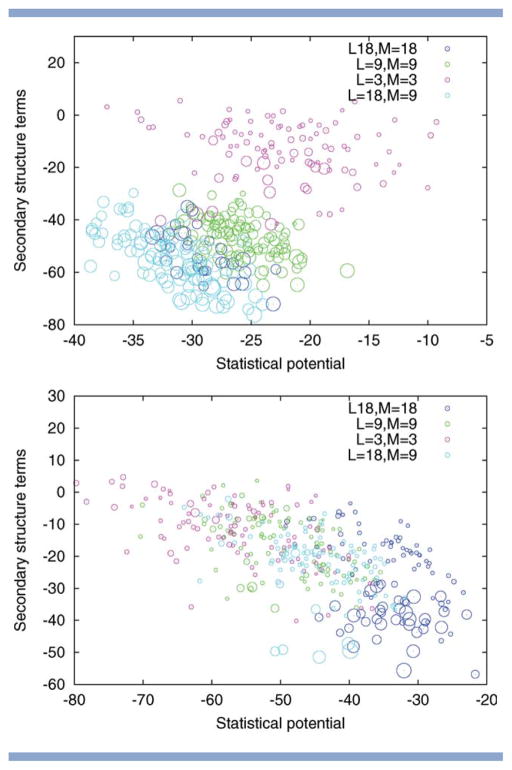
Figure 10.
Alpha-beta proteins. Two-dimensional visualization of the solutions returned by Rosetta for different choices of fragment length L and move size M. Top to bottom: PDB code 1hz6, 1tig. The size of the circle indicates the quality of the model with larger circles indicating those with a lower RMSD. The position of the circles is determined by the energy subscores corresponding to the statistical potential and the secondary structure terms (both to be minimized). The figure illustrates that the fragment length L and the move size M influence how well these individual subscores are optimized. For PDB code 1tig, variation of L and M results in different trade-offs between the subscores with small moves favoring the statistical potential and large moves biasing the search toward solutions with low secondary structure terms. For PDB code 1hz6, the pattern is different, as the two subscores are correlated, resulting in an overall advantage of runs with large L.

