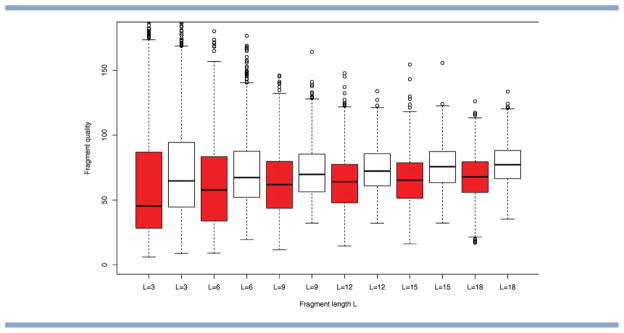
Figure 9.

Quality of the fragment libraries. Comparison for PDB code 1fna (dark) and 1tit (white) for F = 25. For each of the fragments, we compute its Euclidean distance (in torsion space) to the corresponding segment of the native structure. The distribution of distances is shown in the form of box-and-whisker plots (as implemented in R). The center, top, and bottom of the box correspond to the median, top, and bottom quartile of the distribution, respectively, with the whiskers indicating the minimum and maximum value reached. [Color figure can be viewed in the online issue, which is available at wileyonlinelibrary.com.]
