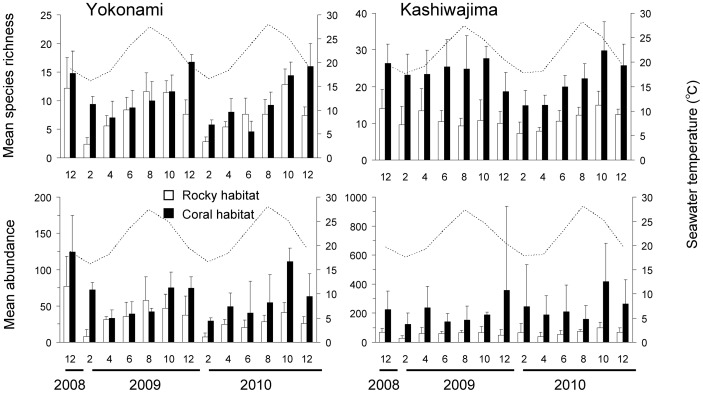
Figure 4. Seasonal patterns in species richness and abundance of fishes in the rocky and coral habitats.
Bars indicate mean species richness and abundance [+standard deviation (SD)] of fishes per transect (n = 5, 1×20 m) in the rocky habitat and coral habitat. Months are labeled by numbers. The dotted line indicates the monthly average seawater temperature (depth, 5 m) around each site. Please note differences in y-axis scale between graphs.

