
Figure 1.
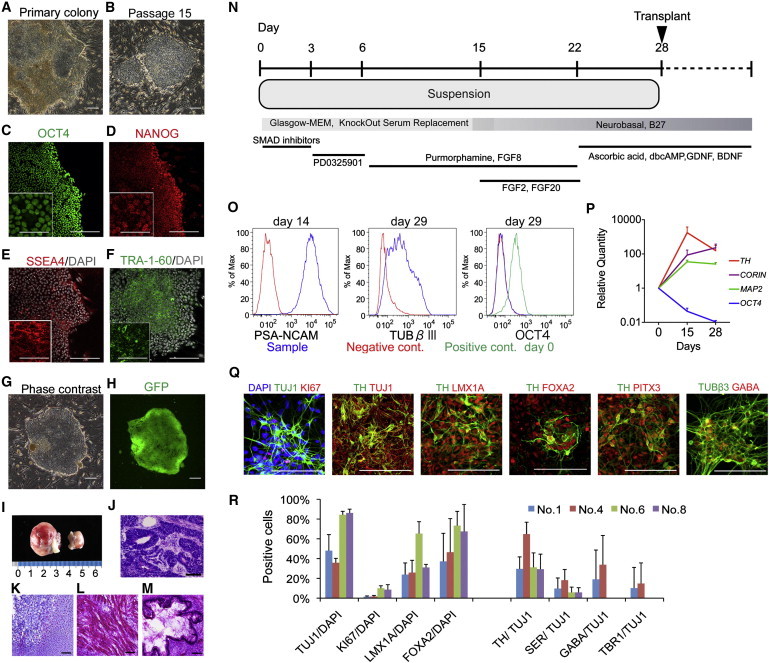
Characterization of Primate iPSCs and iPSC-Derived Neurons
(A–H) Phase-contrast images (A, B, and G) and immunostaining for pluripotent markers (C–F) of iPSCs (T7). GFP was detected during live imaging (G and H) in the same field.
(I–M) Teratoma formation at 3 months after transplantation in the testes of SCID mice. H&E staining of the sections showed histological features of the neuroepithelium (J), cartilage (K), muscle (L) and gut-like epithelium (M).
(N) The protocol used for neural differentiation.
(O) Expression analyses of neural markers and Oct4 by flow cytometry. The negative control was a cell sample stained only by secondary antibody (PSA-NCAM) or the isotype control (TUBβIII and OCT4). The positive control for OCT4 was undifferentiated (day 0) iPSCs.
(P) qPCR for the differentiation of donor cells. The data are shown as the means ± SD (n = 4 independent experiments).
(Q) Immunostaining of primate iPSC-derived neurons on day 39.
(R) Quantification of immunocytochemical analyses for each iPSC line. Data are shown as the means ± SD (n = 3 independent experiments). SER, serotonin, TUBβIII, β-tubulin class III. Scale bars: 200 μm in (A)–(H), 50 μm in insets of (C)–(F), 100 μm in (J)–(M) and (Q).