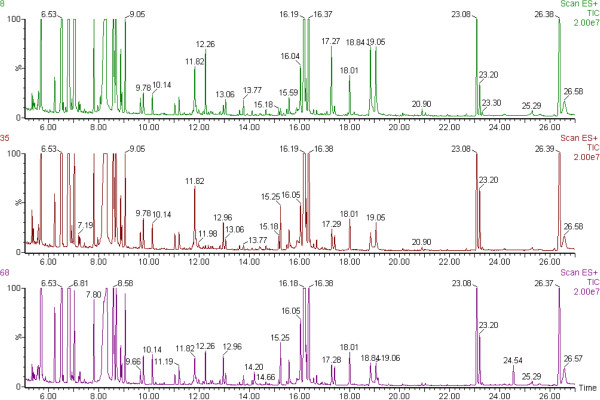
Figure 1.
The representative GC/MS chromatograms of plasma samples from No. 8 of normal control (NC, purple peaks) cows, No. 35 of cows with subclinical ketosis (SK, brown peaks) and No. 68 of cows with clinical ketosis (CK, green peaks). X-axis is retention time (min); Y-axis is intensity of MS (%).

