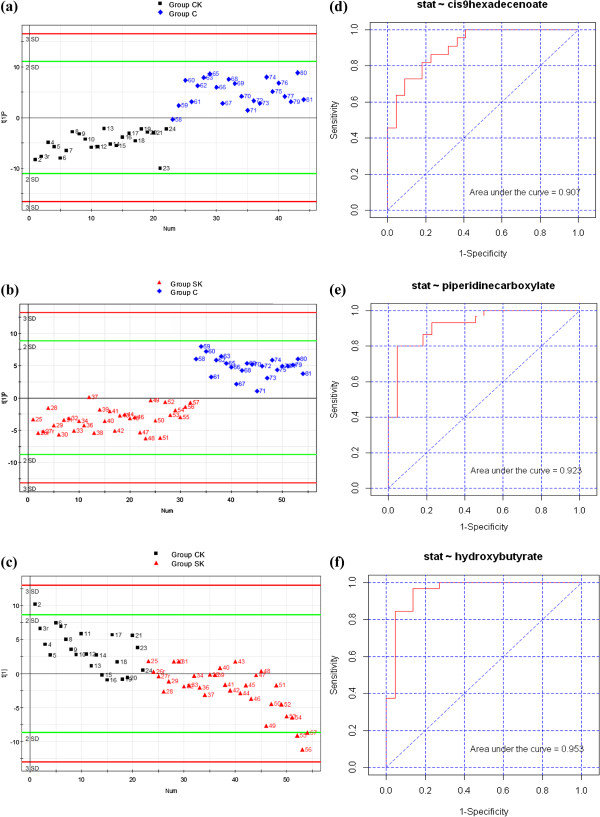
Figure 3.
The OPLS-DA scores plot and ROC plot of plasma obtained from arbitrary two groups. (a, b, c) Score plot of OPLS-DA of using Principal Component 1 (PC1) in Group CK vs. NC, Group SK vs. NC, and Group CK vs. SK respectively; (d, e, f) ROC plot of cis-9-hexadecenoic acid, 2-piperidinecarboxylic acid, and 3-hydroxybutyric acid in the diagnosis in Group CK vs. NC, Group SK vs. NC, and Group CK vs. SK respectively.

