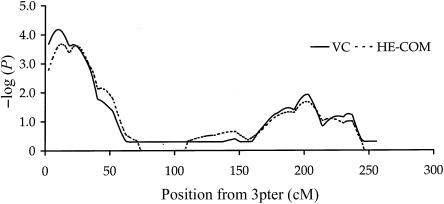
Figure 2 .
Multipoint variance-components and HE-COM linkage analyses of adult stature, with 23 microsatellite markers on chromosome 3. For comparison between the two analyses, variance-components LOD scores are presented as −log10(nominal P value). QMS2 assigns P=1 for zero or negative values of the test statistic.

