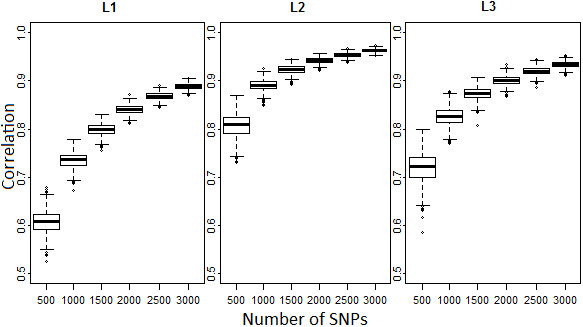
Figure 1.

Bootstrap analysis for inbreeding. Box plot of correlation between the inbreeding coefficients estimated using each replicate (n = 1,000) of the subsets of LE markers and inbreeding coefficients estimated using the full set of LE markers for each line. Median is given in bold.
