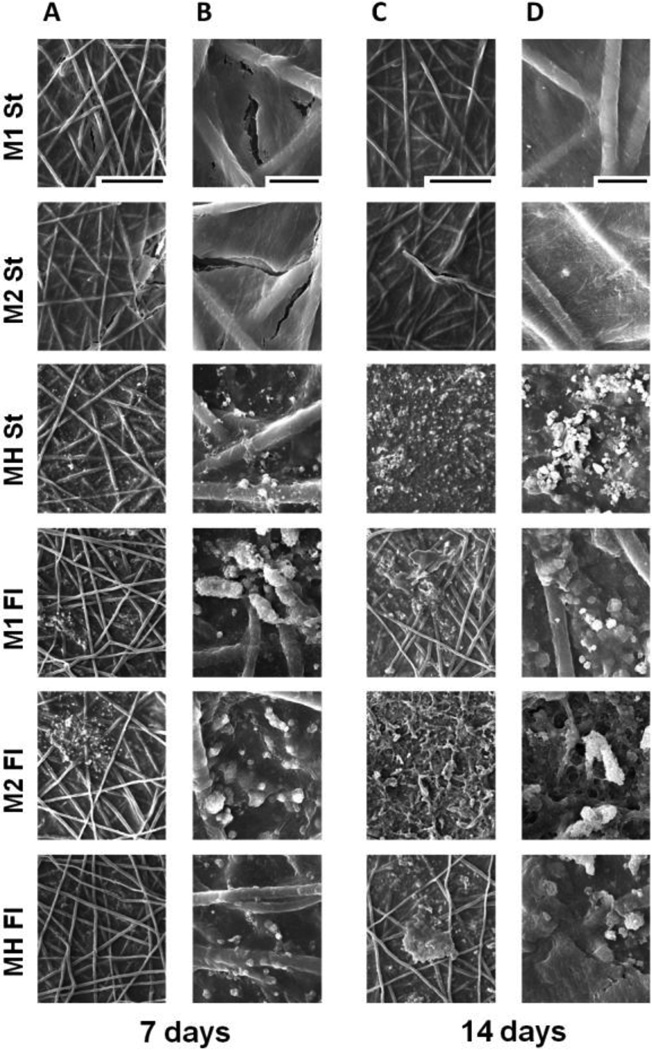
Figure 5. Scanning electron micrographs of the top surfaces of constructs cultured for 7 or 14 days in static (St) or flow perfusion (Fl) conditions.
Scaffolds were seeded with either low (M1) or high (M2) densities of hMSCs, or co-cultures of hMSCs and HUVECs (MH). Samples were taken after 7 and 14 days of culture. Panels A and C are magnified at 300x, and the scale bar is 200 µm and applies for all images in these panels. Panels B and D are magnified at 1600x, the scale bar is 30 µm and applies for all images in these panels.

