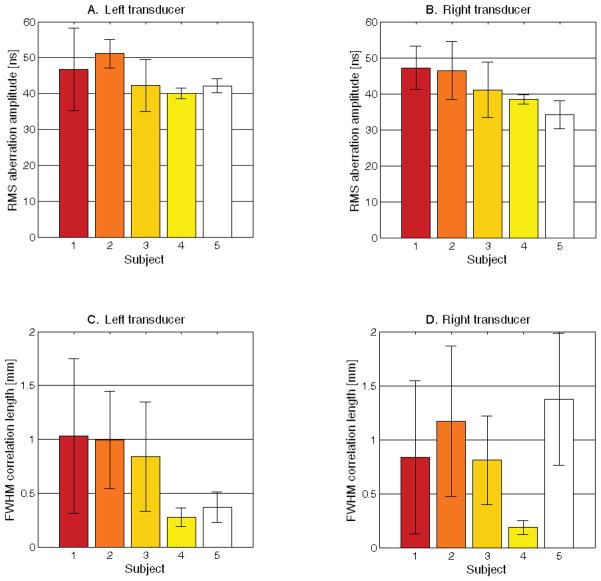
Figure 9.
Measured RMS bilateral aberration strengths for each subject (A and B) displaying the mean and standard deviation from 5 isoplanatic patch measurements. A larger standard deviation indicates a larger variation in aberrator strength among different isoplanatic patches within a single subject. Measured FWHM correlation lengths are also shown for each subject (C and D). A larger standard deviation indicates greater variation in the maximum spatial frequency content among different isoplanatic patches within a single subject.

