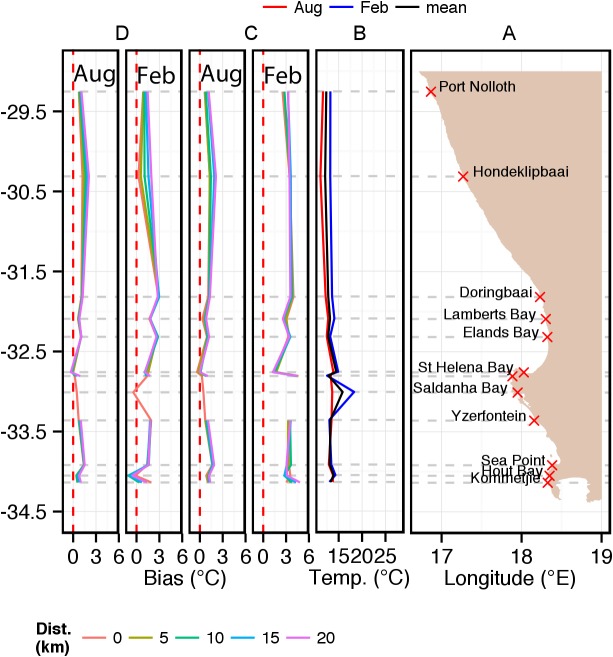
Figure 3. Alongshore seasonal trends (February = summer; August = winter) for in situ temperatures on the west coast of South Africa and concomitant biases in equivalent satellite-derived SST products: (a) indicates the locations of measurement sites; (b) in situ temperature with annual mean, summer and winter climatologies; (c, d) relative biases in the equivalent satellite-derived products of Pathfinder and MODIS Terra.
The coloured lines in (c) and (d) depict the bias measured at 0, 5, 10, 15 and 20 km from the coast (see key).

