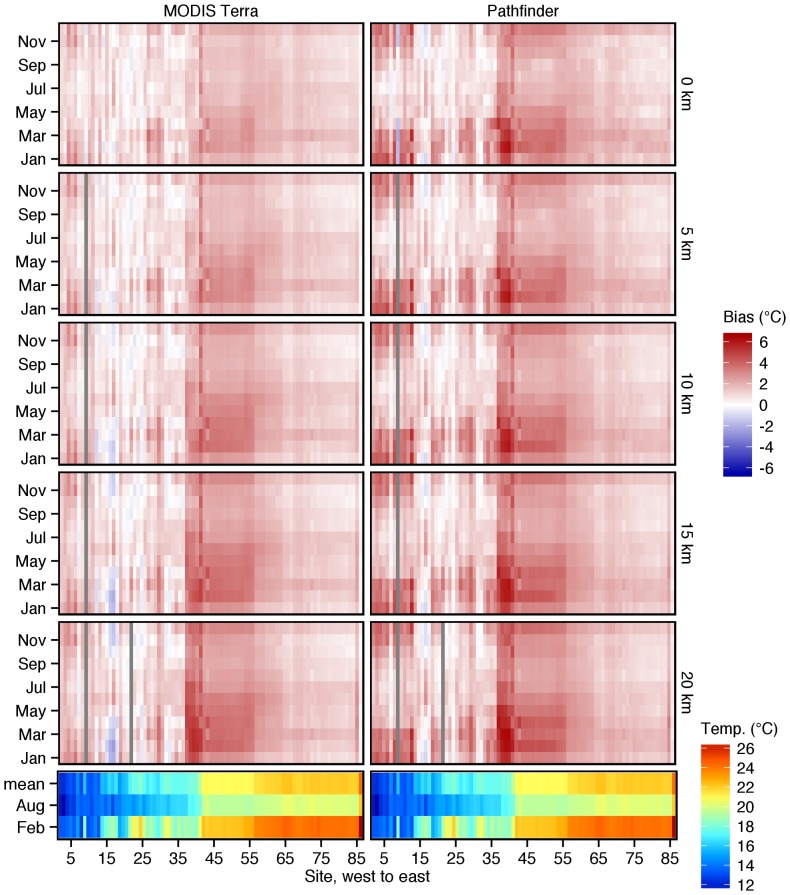
Figure 7. A raster image of MODIS Terra (left panels) and Pathfinder (right panels) biases with respect to in situ temperatures.
Sites, numbered sequentially from west to east, run down the columns, and the rows within the panels depict the months of the year. The upper five panel rows show the biases at various distances from the shore (0, 5, 10, 15 and 20 km). The brightly coloured bottom row of panels is the corresponding in situ temperatures, with mean, February and August in the rows, and sites going down the columns. Note that the bottom left and right panels are identical, and illustrate the same temperatures that are also shown in Figures 3, 4 and 6.

