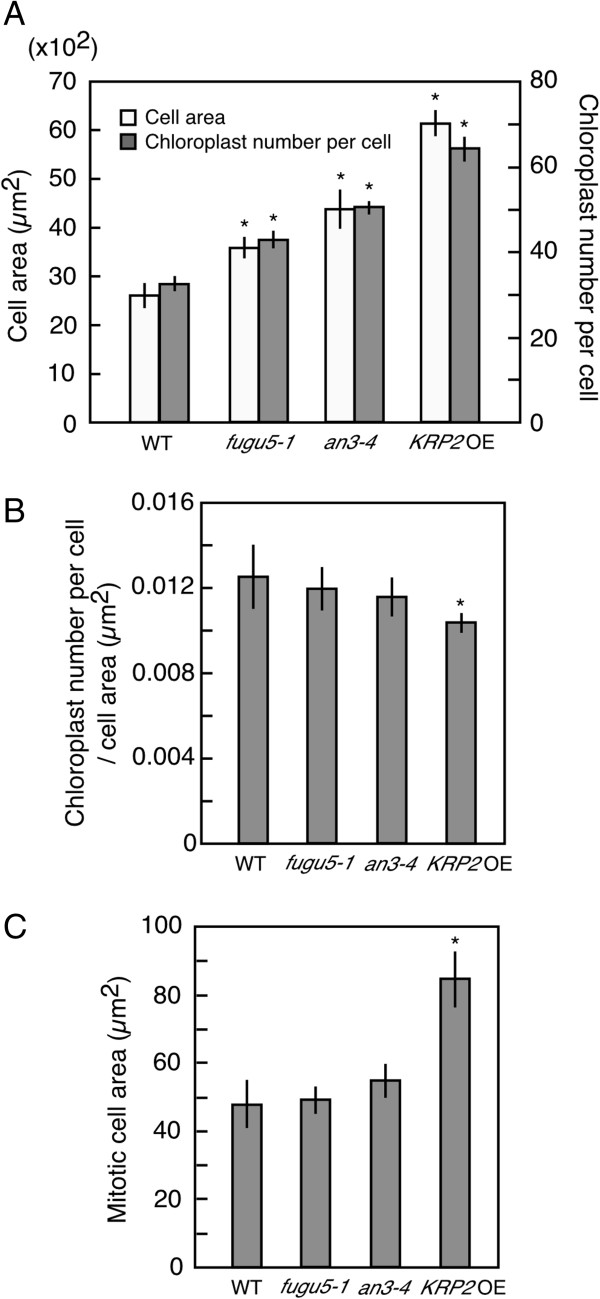
Figure 2.

Increased number of chloroplasts per cell in the leaves of compensation-exhibiting lines. (A) Cell area and chloroplast number per cell measured in subepidermal palisade cells of WT, fugu5-1, an3-4 and KRP2 OE leaves. Leaf samples are from 21-day-old plants. The means ± SD of WT, fugu5-1, an3-4 and KRP2 OE lines are indicated. (B) Ratio of chloroplast number per cell/cell area in WT, fugu5-1, an3-4 and KRP2 OE leaves. (C) Area of mitotic subepidermal palisade cells of WT, fugu5-1, an3-4 and KRP2 OE leaf primordia. Leaf primordia are from 5-day-old seedlings. Asterisk indicates significant difference at P < 0.01 compared with WT (Student’s t-test).
