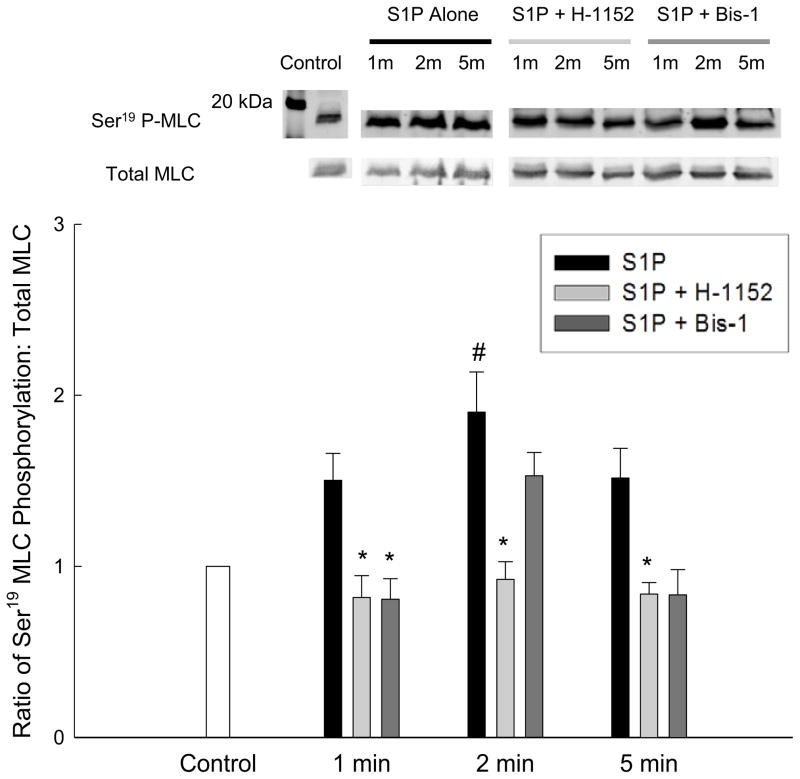
Fig. 5.
The effect of PKC or ROCK inhibition on S1P-induced Ser19 MLC phosphorylation in rabbit bladder smooth muscle. Ser19 MLC phosphorylation was measured in response to 10 μM S1P in the presence or absence of 3 μM Bis-1 or 1 μM H-1152. The top panel shows representative Western blots whereas the bottom panel shows the averaged results of 3 – 5 blots, depending on the treatment condition. Statistical comparisons were made by one-way ANOVA with selected Bonferroni post-hoc tests. Values shown are the means ± S.E.M. of 3 – 5 experiments. * P < 0.05 compared with S1P alone at the same time point. # P < 0.05 compared with control.

