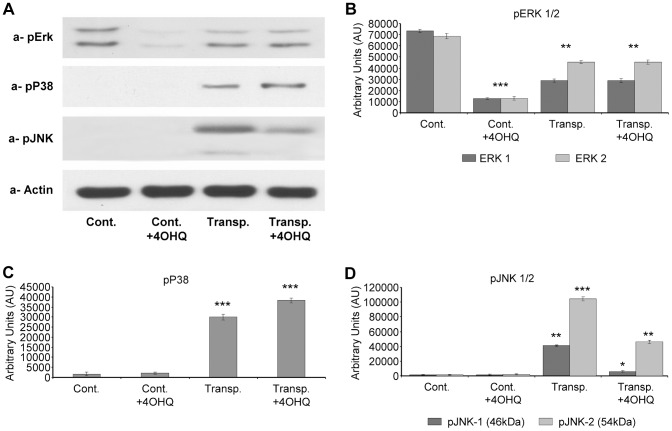
Figure 6. Effect of PARP inhibitor on activation and phosphorylation of ERK1/2, JNK1/2 and p38 MAP kinase pathways in transplanted and control kidney samples.
(A) Effects of PARP inhibitor on the ERK1/2, JNK1/2 and p38 MAP kinase phosphorylation and activation in control and transplanted kidneys determined by immunoblotting with phospho-specific primary antibodies. Actin was used as loading control (B) The bar diagrams represent pixel volumes of ERK1/2 phosphorylation bands. The bands were normalized to the appropriate actin band. (p-ERK1) *p<0.001 control PARP inhibitor treated samples compared to control samples. **p<0.01 control PARP inhibitor treated samples compared to transplanted kidney samples independently from PARP inhibitor treatment. ***p<0.05 control untreated sample compared to transplanted kidney samples independently from PARP inhibitor treatment. (p-ERK2) *p<0.001 control PARP inhibitor treated samples compared to control samples. **p<0.01 control PARP inhibitor treated samples compared to transplanted kidney samples independently from PARP inhibitor treatment. ***p<0.05 control untreated sample compared to transplanted kidney samples independently from PARP inhibitor treatment. The bar diagrams represent pixel volumes of p-p38 MAK kinase phosphorylation bands. The bands were normalized to the appropriate actin band. *p<0.001 control samples compared to transplanted kidney samples (independently of PARP inhibitor treatment). **p<0.05 untreated transplanted kidney samples compared to control PARP inhibitor treated transplanted kidney samples. The bar diagrams represent pixel volumes of phosphorylated JNK1/2 bands. The bands were normalized to the appropriate actin band. (p-JNK1) *p<0.05 transplanted untreated kidney samples compared to all others samples. (p-JNK2) **p<0.001 control kidney samples (independently of PARP inhibitor treatment) comparing to transplanted samples. ***p<0.05 transplanted untreated kidney samples compared to transplanted PARP inhibitor treated kidney samples. The vertical axes represent pixel volume means±SEM of the scanned bands of the immunoblots in arbitrary units.

