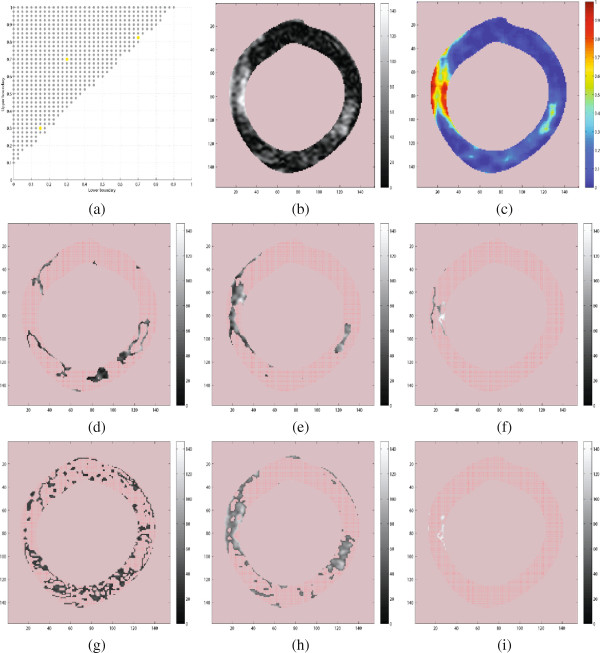
Figure 10.
Exploring cardiac segments of a patient implanted with ICD. (a) The coordinates (L,U) shows all cardiac segments (CS) corresponding to the intervals L - U. (b) An image slice from a patient from the group with high risk of arrhythmia, (c) The corresponding probability map, and (d–f) the cardiac segments corresponding to the yellow (L,U) coordinates CS1, CS2, and CS3. Subplots (g–i) shows the corresponding cardiac segments derived without probability mapping.

