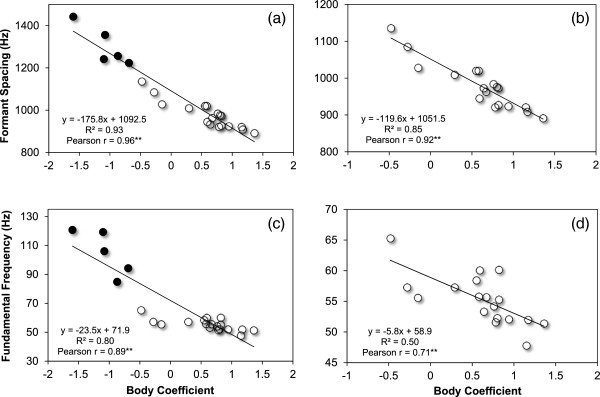
Figure 5.

Correlations between formant spacing (a, b) as well as fundamental frequency (c, d) and the calculated body coefficient (BC). The left graphs shows the measures of all subjects (black dots indicating females, N = 5, and white dots indicating males, N = 18); the right graphs only show measures of males. BC is a compound measure of body size calculated from all body measurements by using principal component analysis. ** indicates statistical significance, p < 0.01 (p values were adjusted by using Simes correction for multiple testing).
