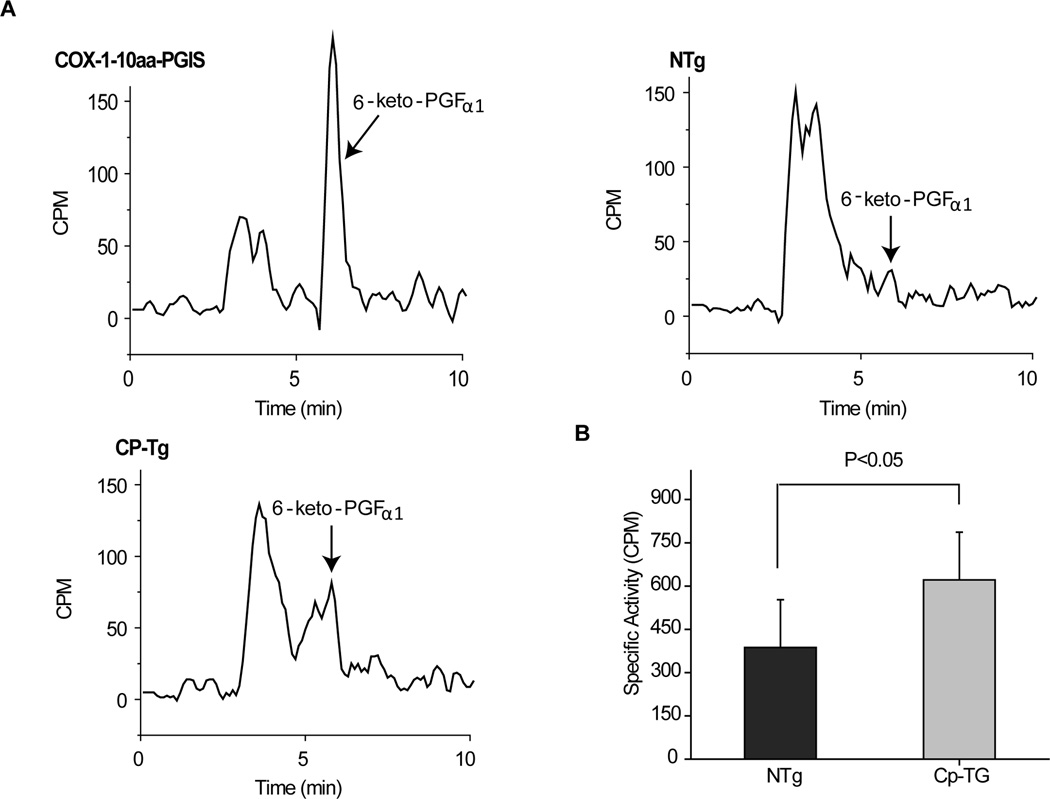
Figure 1. Measurement of PGI2 production in brain.
(A) Examples showing 6-Keto-PGF1α detected using HPLC, using a positive control (COX-1-10aa-PGIS positive cell lysate), non-transgenic mouse, and TG-Cp mouse brain tissue. (B) This figure demonstrates that CP-Tg mouse tissue exhibits enhanced conversion of arachidonic acid to PGI2 (n=3, for each group, p<0.05), compared with control.

