
Figure 2.
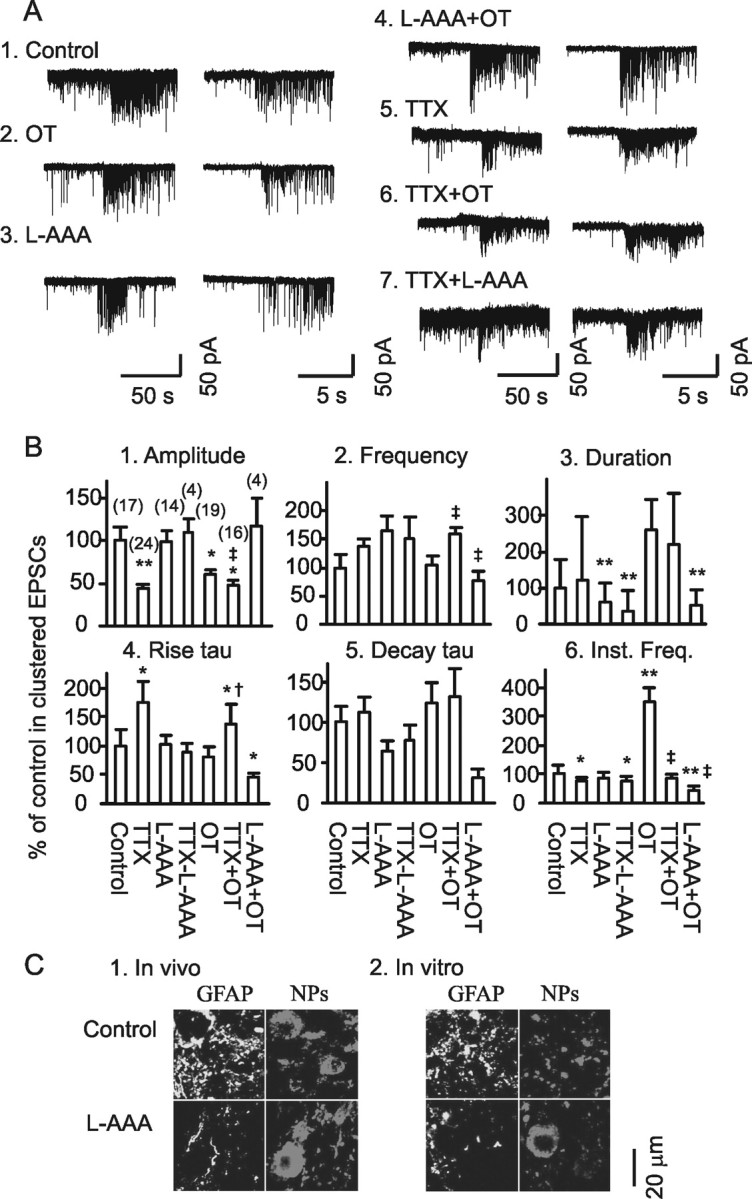
Clustered EPSCs and their sources. A, Exemplary clustered EPSCs (left) and their expanded episodes (right) under different conditions in brain slices. Each example is taken from a period of 30 min recording at a holding membrane potential −70 mV. A1, A2, In normal aCSF and in 10 pm OT. A3, A4, In the presence of 0.25 mm l-AAA without (A3) and with OT (A4). A5–A7, In the presence of 0.5 μm TTX, TTX plus 10 pm OT or plus 0.25 mm l-AAA on miniature EPSCs. B, Bar graphs showing the amplitude (B1), frequency (B2), duration (B3), rise time constant (tau; B4), decay tau (B5), and instantaneous frequency (Inst. Freq.; B6) of the clustered EPSCs under different conditions as marked in the graphs. *p < 0.05 and **p < 0.01 compared with the control; †p < 0.05 and ‡p < 0.01 compared with OT only. The numbers in parentheses in B1 are that of clustering events. C, Confocal images showing immunostaining for GFAP and neurophysins (NPs) of OT and vasopressin. C1, Effect of intracerebroventricular application of l-AAA (10 mm, 1 μl, 1.5 h). C2, Effects of incubation of brain slice in the presence of l-AAA (0.25 mm, 30 min) on GFAP expression.