
Figure 3.
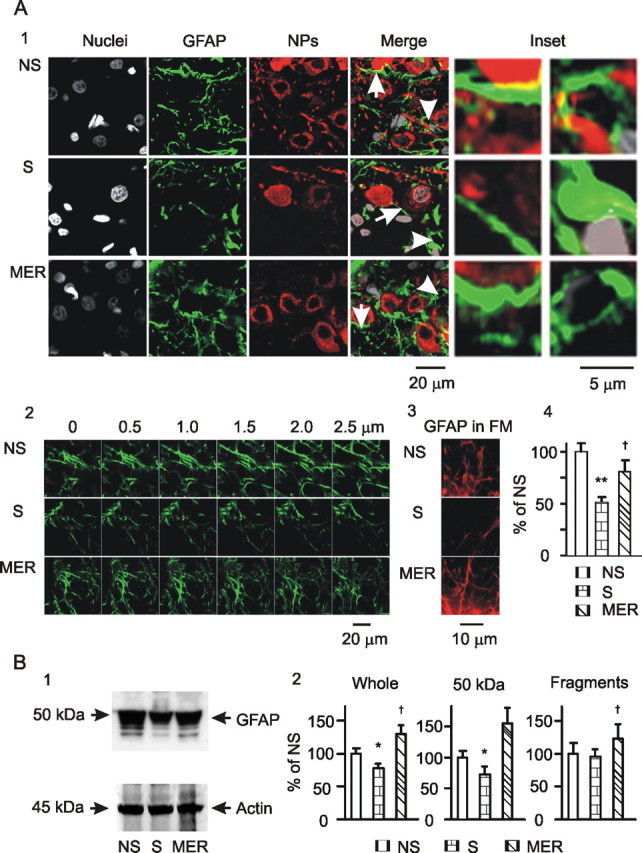
GFAP expression in the SON at different stages of suckling. A, Microscopic images. A1, Exemplary images in single-scan model showing nuclei, GFAP, neurophysins (NPs), their merges, and insets (from left to right) in rats, non-suckling (NS), during suckling (S), and immediately after suckling-induced MER. The insets show the special areas in the merge channel indicated by the arrows (GFAP filaments, left insets) or arrowheads (GFAP at somata, right insets). A2, GFAP images in Z-stack model of confocal microscopy with 0.5 μm distance between two consecutive sections. A3, GFAP images in fluorescence microscopy (FM) of 400× amplification. A4, Summary graphs (n = 6) for A1 showing relative intensity of GFAP at different stages of suckling. B, GFAP expression in Western blots. B1, Exemplary bands from left to right showing GFAP proteins (top) during non-suckling, suckling, and the MER and their corresponding loading controls with actin (bottom). B2, Summary graphs (n = 3) showing relative amounts of GFAP to the control (NS) in the whole bands, bands at 50 kDa (full size), and their smaller fragments, respectively. *p < 0.05 and **p < 0.01 compared with non-suckling; †p < 0.05 compared with suckling. Other annotations refer to Figure 2.