Figure 4.

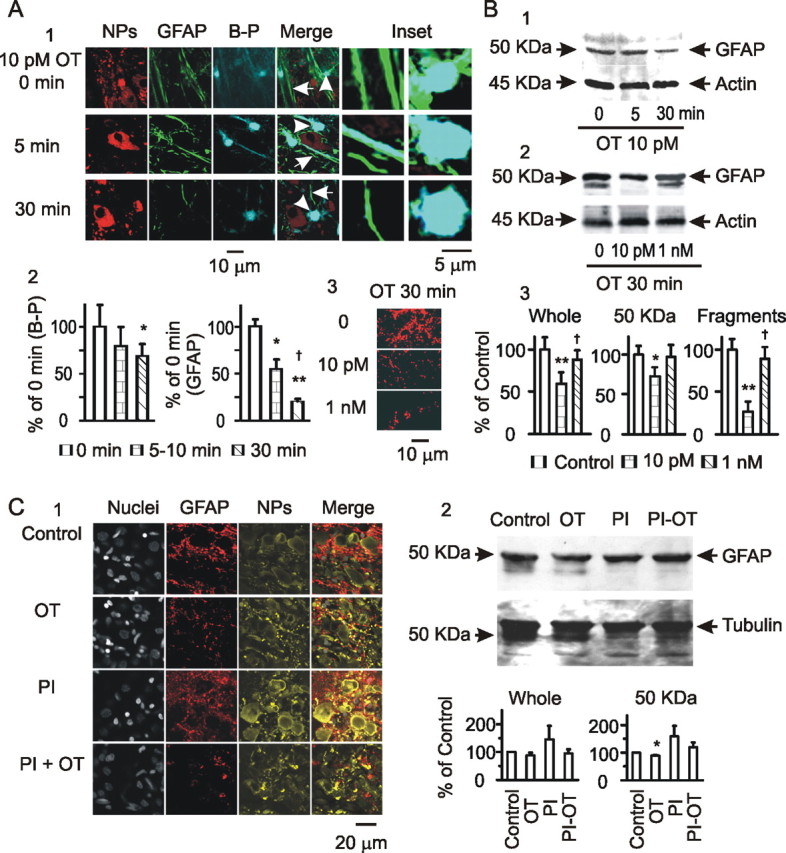
Effects of OT on astrocytic plasticity in the SON. A, GFAP expression in astrocytes in brain slices. A1, Exemplary images of neurophysins (NPs), GFAP, Bauer Peptide (B-P), their merges, and insets (from left to right) at 0, 5, and 30 min of OT treatment. A2, Summary graphs showing relative intensity of Bauer Peptide loading (n = 3) and GFAP staining (n = 8) relative to the control (OT at 0 min). *p < 0.05 and **p < 0.01 compared with 0 min; †p < 0.05 compared with 5 min. A3, GFAP images in response to different concentrations of OT (30 min). B, GFAP expression in Western blots. B1, Exemplary bands (from left to right) showing GFAP proteins (top, using mouse antibody from Sigma, G3893) and the loading controls (actin, bottom) at 0, 5, and 30 min of 10 pm OT treatment. B2, GFAP and actin at 30 min of 0, 10 pm, and 1 nm OT treatments. B3, Summary graphs (n = 3) showing relative amounts of GFAP to the control in the whole bands, bands at 50 kDa (full size), and the smaller fragments, respectively. *p < 0.05 and **p < 0.01 compared with control (0 OT); †p < 0.05 compared with 10 pm OT. C, Effect of protease inhibitors (PI) on OT-evoked GFAP expression. C1, Exemplary confocal images showing GFAP expression in control, OT (0.1 nm, 30 min), a mixture of protease inhibitors (45 min), and protease inhibitors (starting 15 min before) plus OT (0.1 nm, 30 min) as labeled. C2, GFAP expression in Western blots. Top panel shows bands of GFAP (top) and tubulin (loading control; bottom); bottom panel shows graphs (n = 4) summarizing whole GFAP proteins (left) and GFAP at 50 kDa (right). Other annotations refer to Figures 2 and 3.
