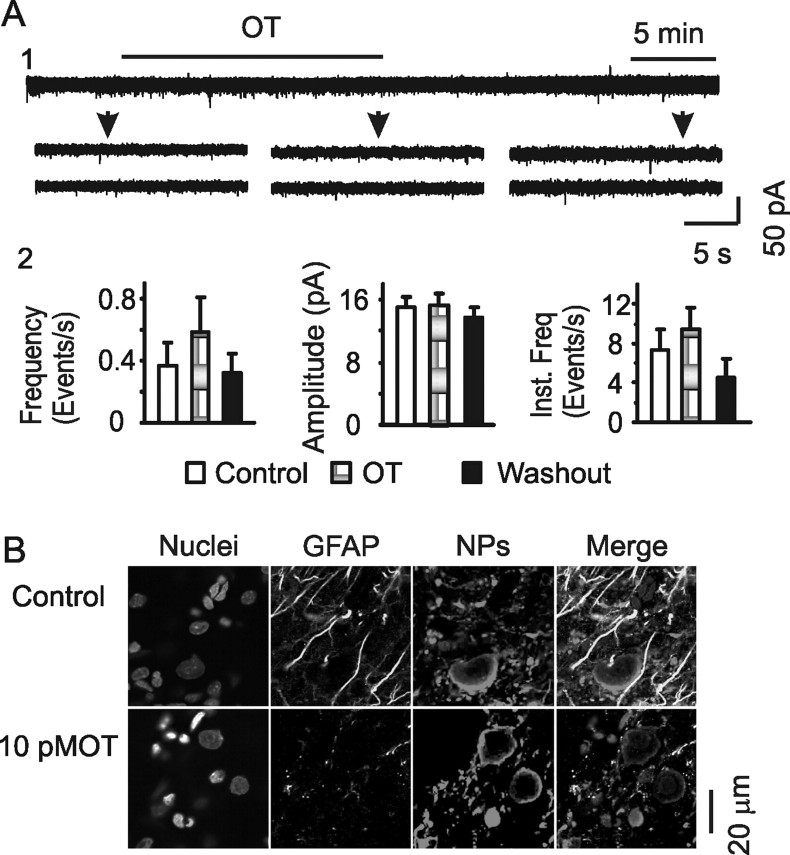
Figure 5.
Effects of OT on GFAP expression after blocking synaptic release. A, Effects of OT (10 pm) on EPSCs after pretreatment of slices with TeTx (10 nm, 2 h). A1, Exemplary voltage-clamp recordings. A2, Summary graphs (n = 8) showing the averaged frequency, amplitude, and instantaneous frequency in control, OT, and washout of OT. B, Confocal images showing effects of OT (10 pm, 30 min) on GFAP expression after the pretreatment of slices with tetanus toxin. Other annotations refer to Figures 1–3.

