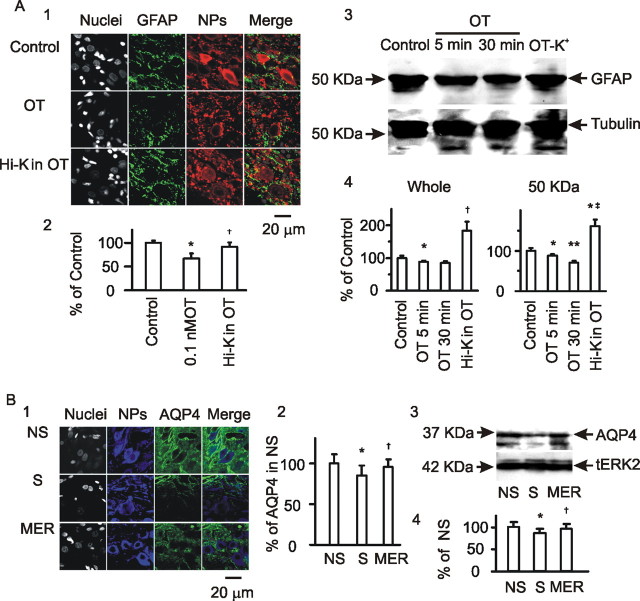
Figure 6.
GFAP plasticity and homeostasis of K+/water in response to OT/suckling. A, Confocal microscopy of GFAP in the SON in slices. A1, Exemplary images of nuclei, GFAP, neurophysins (NPs), and their merges (from left to right) at control, OT (0.1 nm, 30 min), and OT (20 min before) plus transient high K+ stimulation (Hi-K; 12 mm, 30 s). A2, Summary graphs (n = 6) showing relative intensities of GFAP. A3, A4, GFAP expression in Western blots and summary graphs (n = 4). †p < 0.05 and ‡p < 0.01 compared with 0.1 nm OT at 30 min. B, Effects of suckling on AQP4 expression in confocal images (B1; n = 6) and in Western blots (B3; n = 3) and their summary graphs (B2, B4), respectively. Other annotations refer to Figures 2 and 3.

