Figure 2.
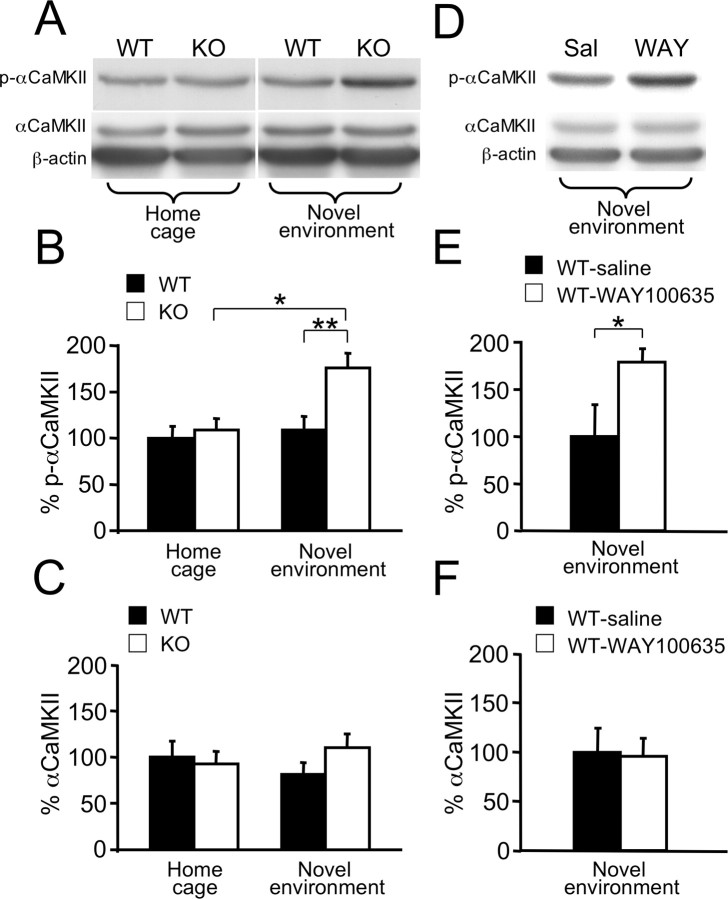
Increased αCaMKII T286 phosphorylation in the hippocampus of Htr1aKO mice or mice treated with WAY100635. A, Representative bands from Western blot analysis of p-αCaMKII, total αCaMKII, and actin immunoreactivity in total hippocampal extracts of P21 wild-type (WT) and Htr1aKO (KO) mice either exposed (novel environment) or not exposed (home cage) to a novel environment for 20 min before being killed. B, Quantification of immunoreactivity revealed a significant increase in p-αCaMKII of KO mice compared with WT in the novel environment, but not home cage condition (home cage: WT, n = 14; KO, n = 16; novel environment: WT, n = 10; KO, n = 9). C, Level of total αCaMKII immunoreactivity was similar in WT and KO mice (home cage: WT, n = 10; KO, n = 13; novel environment: WT, n = 11; KO, n = 9). D, Representative bands from Western blot analysis of p-αCaMKII, total αCaMKII, and actin immunoreactivity in total hippocampal extracts of P21 wild-type mice during chronic treatment with the selective Htr1a antagonist WAY100635 (WAY; 0.15 mg/kg/h) or with saline (Sal) and after novel environment exposure. E, F, Quantification of immunoreactivity revealed a significant increase in p-αCaMKII (E) but not total αCaMKII (F) for mice treated with WAY100635 (WT-WAY100635; n = 6) when compared with the saline control (WT-saline; n = 5). Data are expressed as a percentage of optical density (intensity units per square millimeter) versus WT, home cage (B, C), or WT-saline (E, F). Error bars indicate mean ± SEM. Intensity of bands was normalized versus actin. *p < 0.05; **p < 0.01.

