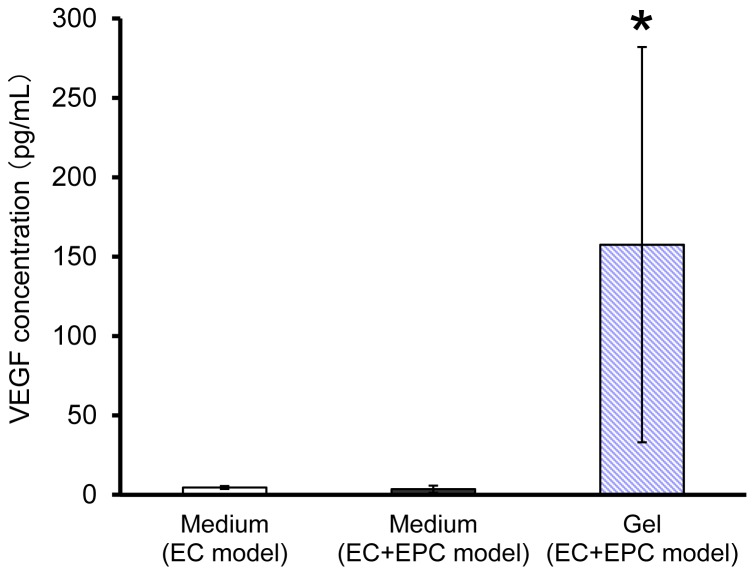
Figure 7. VEGF concentration in 3D endothelial network models.
CM from the EC and EC+EPC models and collagen gel from the EC+EPC model were collected and analyzed by ELISA to compare VEGF concentrations. The concentration of VEGF in collagen gel was significantly more than that in CM from the EC and EC+EPC models. Data are presented as the means ± SD (n = 3–8; *p < 0.03 versus CM from EC and EC+EPC models).

