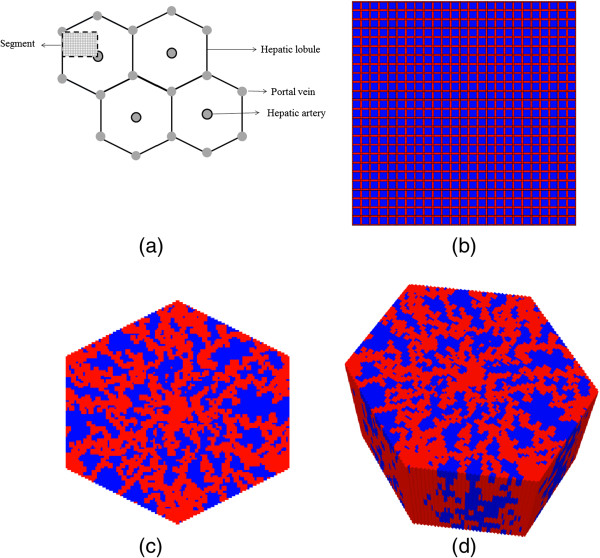
Figure 1.
Flow network structure. (a) Schematic diagram of a cross section of hepatic parenchyma consisting hexagonal lobules, portal and hepatic veins. The lobule contains liver cells (sinusoids and hepatocytes). The segment represents a typical area studied in this paper. (b) Homogeneous lattice (segmented area) with high porosity bands (in red) representing sinusoids and lower porosity regions (in blue) representing tissue containing hepatocytes. (c) 2D hexagonal lobule lattice with sinusoids generated via a diffusion limited aggregation algorithm. (d) 3D hexagonal lobule lattice.

