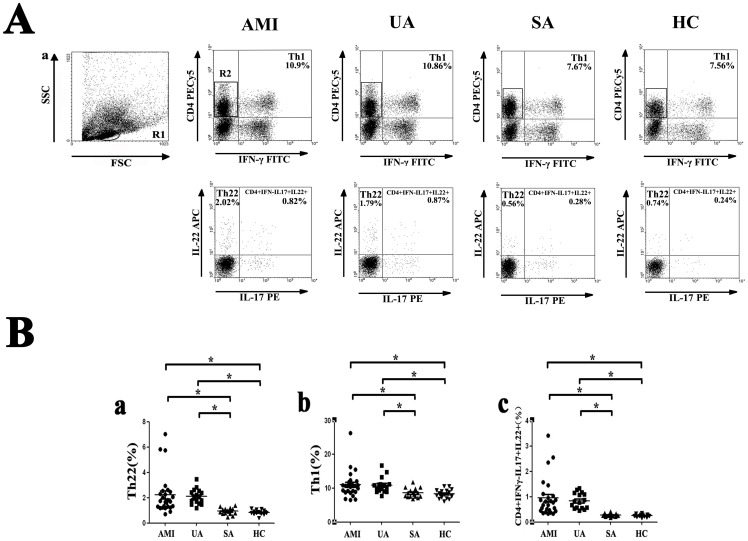
Figure 1. Flow cytometric analysis of Th1 cells, Th22 cells and CD4+IFNγ−IL17+IL-22+ cells.
Peripheral blood from patients with AMI, UA, SA and HC subjects were stimulated with PMA, ionomycin and monensin for 4 h, and then stained with labeled antibodies as described in Methods. A, Gating strategies and representative flow cytometry dot plot results of each group. Lymphocytes were gated in R1 by forward and side scatter gating. These cells were analyzed for IFN-γ producing and CD4 expression T cells. CD4+ IFN-γ− cells were gated in R2 and analyzed for IL-17 and IL-22 producing T cells. Numbers represent the percentage of cells in the quadrants. B, Comparison of the percentages of circulating Th22 cells (left panel, % of CD4+IFN-γ− cells), Th1 cells (middle panel, % of total lymphocytes) and CD4+IFNγ−IL17+IL-22+ cells (right panel, % of CD4+IFN-γ− cells) from AMI, UA, SA patients and healthy controls. (* = P<0.05, AMI and UA vs. SA and HC).

