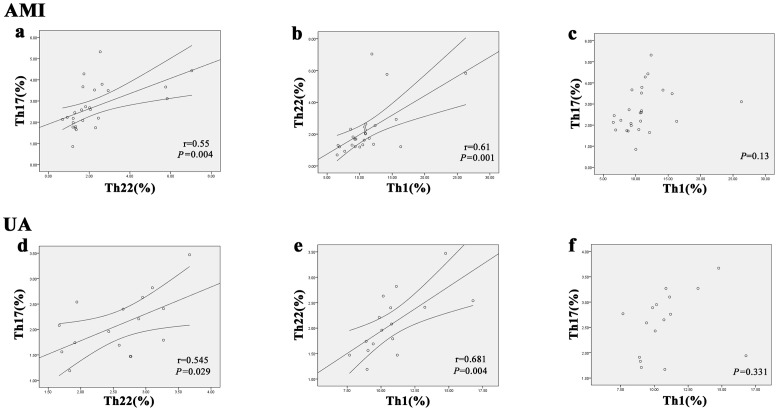
Figure 3. Correlation analysis between the percentages of Th17 cells, T22 cells and Th1 cells in AMI and UA patients.
a and d, Correlation between percentages of Th17 cells and T22 cells in AMI (r = 0.55, P = 0.004) and UA (r = 0.545, P = 0.029) patients. b and e, Correlation between percentages of Th22 cells and T1 cells in AMI (r = 0.61, P = 0.001) and UA (r = 0.681, P = 0.004) patients. c and f, Correlation between percentages of Th17 cells and T1 cells in AMI (p = 0.13) and UA (p = 0.331) patients.

