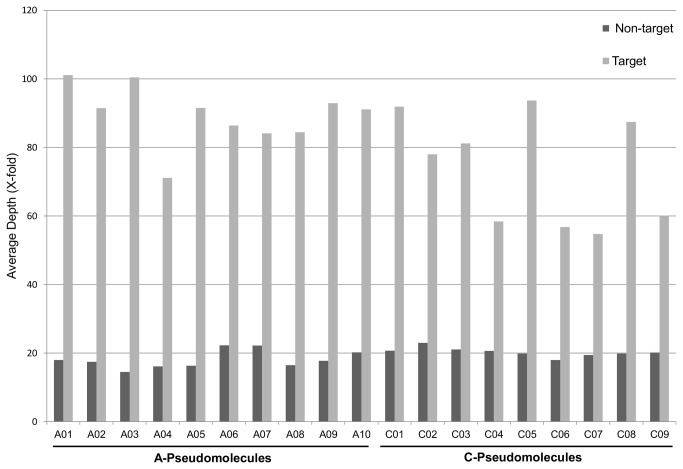
Figure 4. Summary of DNA sequence coverage.
The average depth of coverage in captured and non-captured regions across all 19 A and C Brassica pseudomolecules is illustrated. Captured regions are those from the original sequence capture selection combined with the orthologous sequence from the complementary genome.

