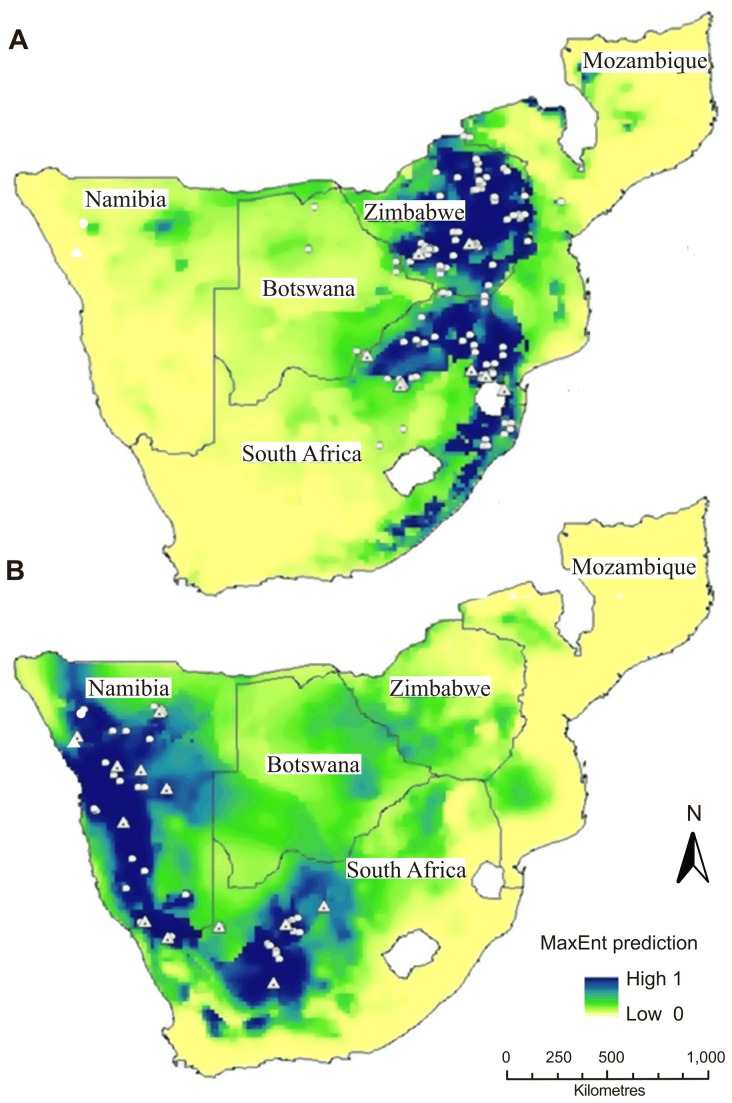
Figure 5. Probability of occurrence for A) R. darlingi and B) R. damarensis in southern Africa.
The predictions (Low-High) show a suitability gradient from 0–1 based on environmental suitability where 0 (low) indicates a zero probability of occurrence and 1 (high) indicates maximum probability of occurrence. White circles indicate locality records used for modelling the species. Dotted white triangles indicate locality records from where DNA sequences were obtained. Variables used in the final model include annual mean temperature, isothermality, temperature seasonality, temperature annual range, mean temperature of the wettest quarter, mean temperature of the driest quarter, mean temperature of the warmest quarter, mean temperature of the coldest quarter, annual precipitation, precipitation seasonality, precipitation of the wettest quarter, precipitation of the driest quarter, and precipitation of the coldest quarter.

