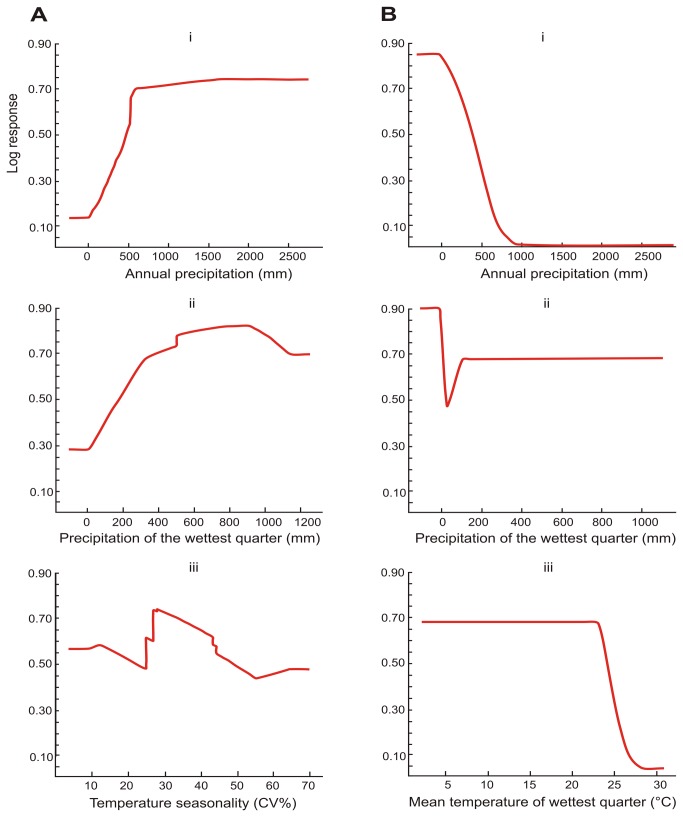
Figure 6. The log response curves for R. darlingi.
A) R. darlingi ; (i) annual precipitation, (ii) precipitation of the wettest quarter, (iii) temperature seasonality when all locality records were used to build the model (temperature seasonality (Coefficient of Variation) is the standard deviation of the monthly temperature estimates expressed as a percentage of the mean of those estimates (i.e., the annual mean); and B) R. damarensis; (i) annual precipitation, (ii), precipitation of the wettest quarter, and (iii) mean temperature of the wettest quarter when all locality records were used to build the model.

