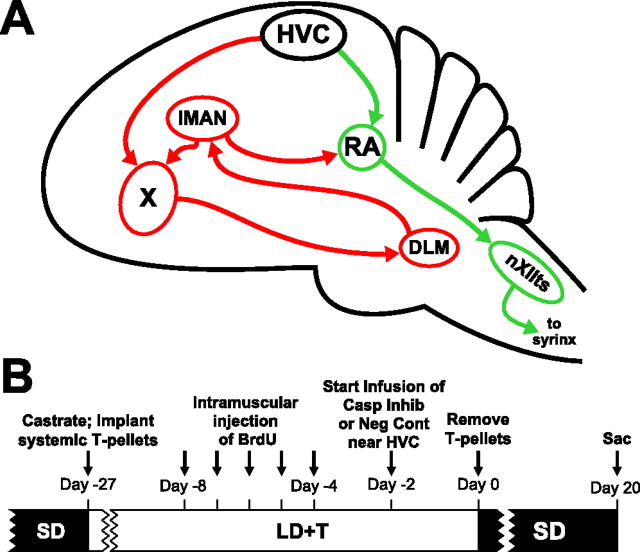
Figure 1.
The avian song control system and timeline for experimental procedures. A, Schematic sagittal diagram of the song control system showing projections of major nuclei. The green arrows indicate the descending motor pathway. The red arrows indicate the anterior forebrain pathway. X, Area X; IMAN, lateral magnocellular nucleus of the anterior nidopallium; DLM, medial part of the dorsolateral thalamic nucleus; nXIIts, tracheosyringeal portion of the hypoglossal nucleus. B, Schematic timeline of the experimental procedures. Birds received daily injections of BrdU for 5 d.

