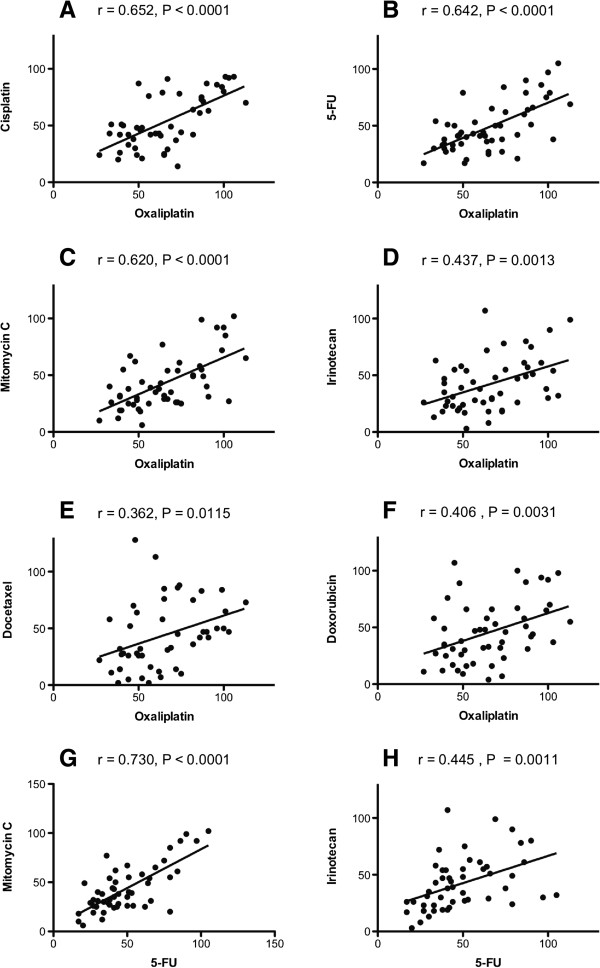
Figure 3.
Correlations between the cytotoxic activities (SI%) for the indicated pairs of standard cytotoxic drugs at concentrations selected to provide optimal activity variation. The correlations are based on all peritoneal carcinoma samples investigated. The r denotes the correlation coefficient and P the level of statistical significance. Panel A: correlation between cisplatin and oxaliplatin, B: 5-fluorouracil and oxaliplatin, C: mitomycin C and oxaliplatin, D: irinotecan and oxaliplatin, E: docetaxel and oxaliplatin, F: doxorubicin and oxaliplatin, G: mitomycin C and 5-fluorouracil, H: irinotecan and 5-fluorouracil.

