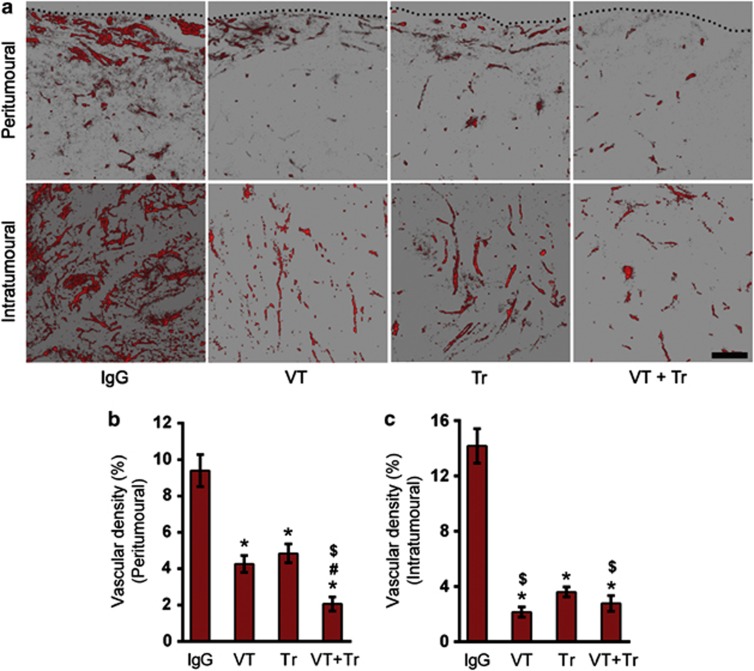
Figure 7.
The effect of treatment on vascular density. Two-dimensional images constructed from Z-stack images showing CD31-positive blood vessels in the peritumoural (a and c) and intratumoral (a and d) regions. The black dotted line indicates the boundary of the tumors. The scale bar represents 100 μm (n=7; *P<0.05 versus isotype control; #P<0.05 versus vascular endothelial growth factor (VEGF)-Trap (VT); $P<0.05 versus trastuzumab (Tr)). IgG, immunoglobulin G.

