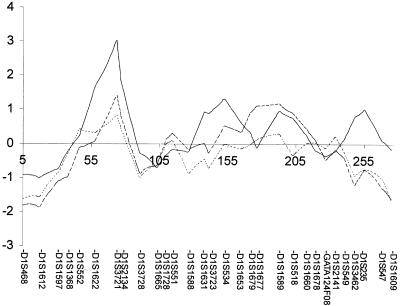
Figure 1.
Evidence for linkage on chromosome 1 in the subgroup with AN. Multipoint NPL z scores (Kruglyak et al. 1996) are plotted, as a function of chromosomal position, for the three categories of families defined in table 1: the subgroup with RAN (n=37 families; solid line), the subgroup with AN (n=127 families; dashed line), and the entire eating-disorder sample (n=192 families; dotted line).

