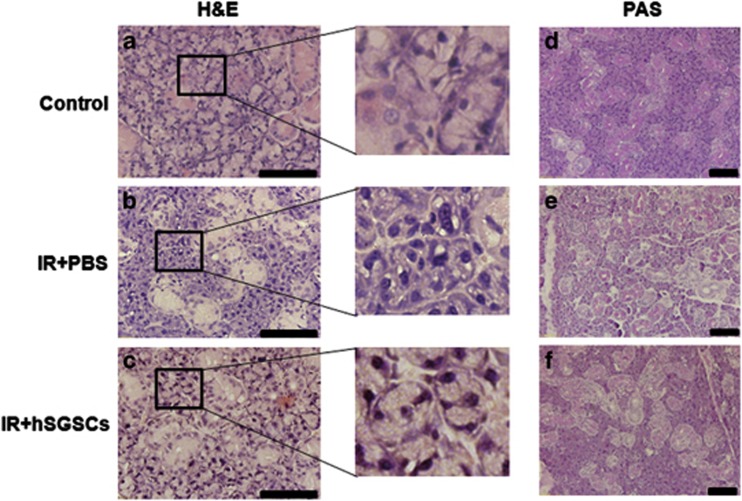
Figure 5.
Histopathological analysis of radiation-damaged and intact salivary gland tissue. (a–c) Hematoxylin and eosin (H&E) staining. The black box shows a magnified region. (d–f) Periodic acid–Schiff's base (PAS) staining. (a and d) Intact control salivary gland. (b and e) Irradiated salivary gland. (c and f) Human salivary gland stem cell (hSGSC)-transplanted irradiated salivary gland. Bar, 100 μm.

