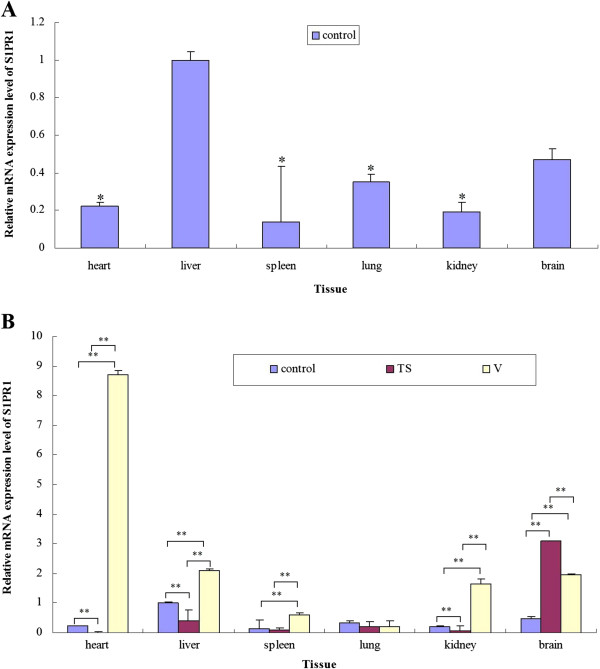
Figure 2.
Relative mRNA expression level of S1PR1 in the detected tissues of control, TS and V groups. A, Relative expression levels of S1PR1 mRNA in control group; B, Differences in expression levels of S1PR1 mRNA between challenged group (TS- or V-) and the control group. *, P < 0.05; **, P < 0.01. Data are represented as mean ± standard deviation (SD). All samples were tested in triplicate.

