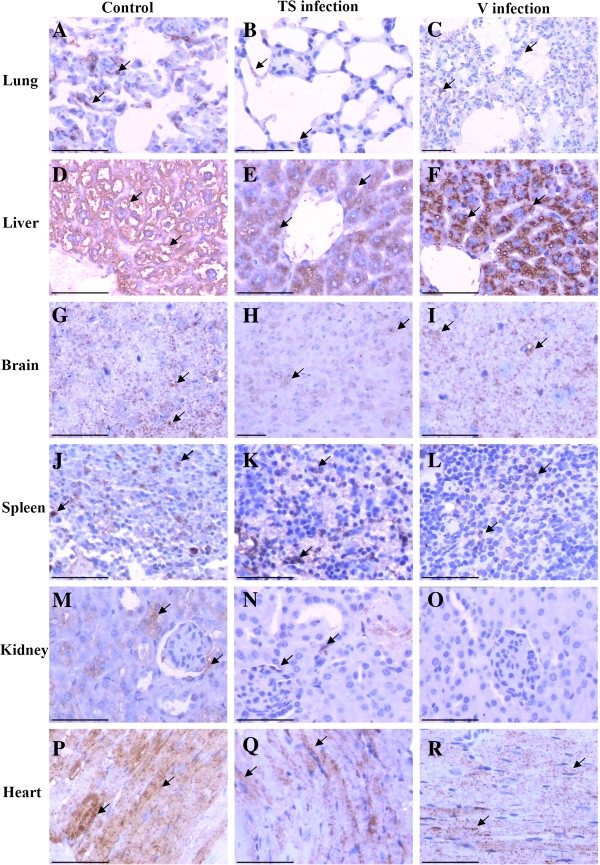
Figure 3.
Distribution of S1PR1 in the tissues of BALB/c mice. Tissues were sectioned and immunohistochemical analysis was performed. Scale bar = 50 μm. A, B and C: lung of control, Ts and V group, respectively; D,E and F: Liver of control, Ts and V group, respectively; G,H and I: brain of control, Ts and V group, respectively; J,K and L: spleen of control, Ts and V group, respectively; M,N and O: kidney of control, Ts and V group, respectively; P, Q and R: heart of control, Ts and V group, respectively.

