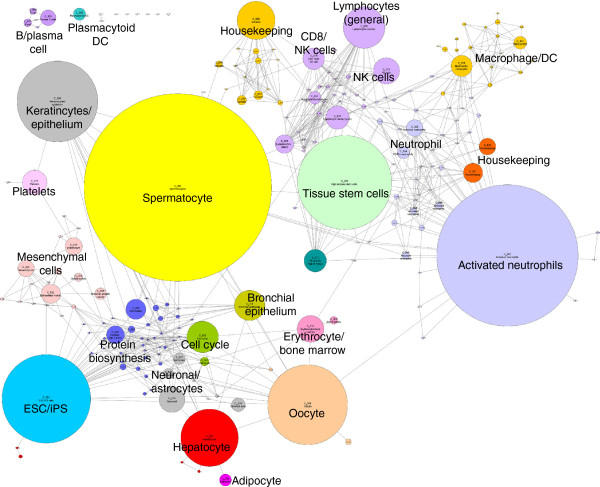
Figure 4.
Collapsed cluster diagram showing the relationship between cluster size and position within the network graph. All the clusters derived from the network graph (Figure 3) with >10 nodes were “collapsed” such that each cluster is presented as a single node with size of the node proportional to the number of probe sets in the cluster. Edges represent instances where nodes in one cluster share correlations (r ≥ 0.75) with nodes in an adjacent cluster. Each cluster number is annotated with its number (C_00N) and clusters are coloured to reflect the underlying biological function or process which they are considered to represent.

