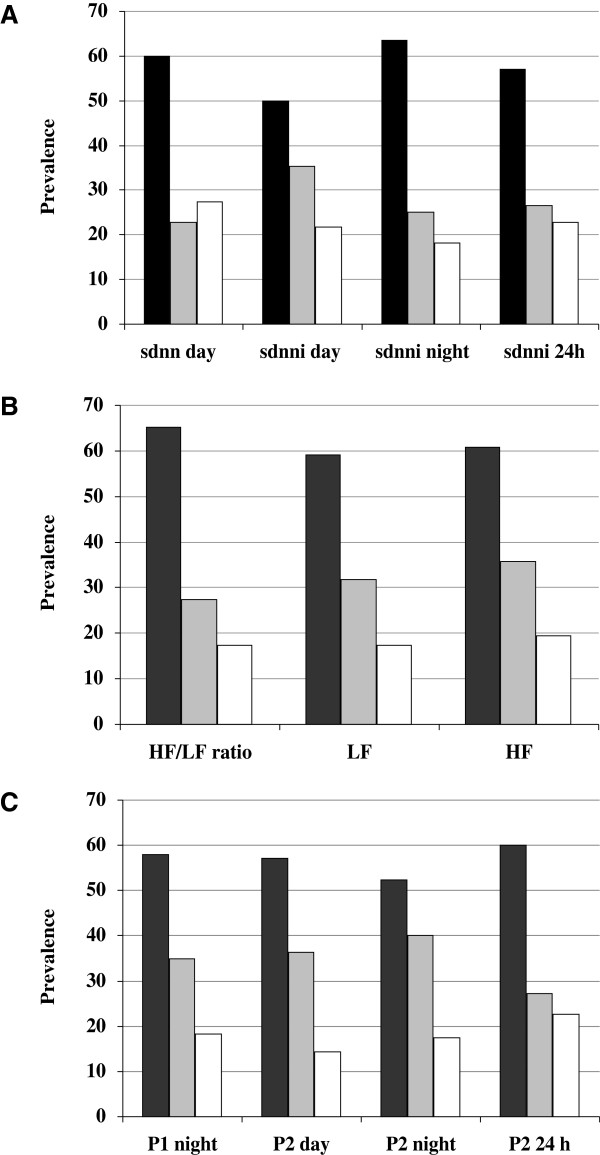
Figure 1.
Prevalence of peripheral artery disease according to autonomic neuropathy. Prevalence of peripheral artery disease within each tertile for individual time domain indices (A), power spectral analyses indices (B), and Three Dimensional Return Map data (C). Black bar represents first tertile, gray bar second tertile, and white bar third tertile. P<0.05 for all comparisons.

