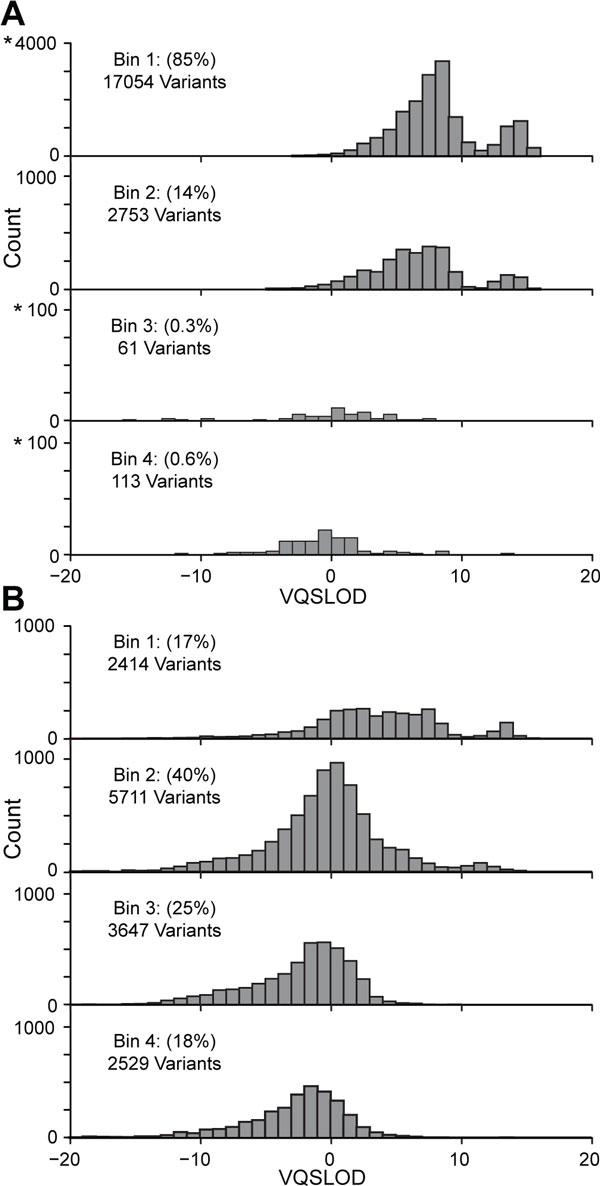
Figure 3.
Comparison of VarBin to VQSLOD. Variants were separated into Bins using the VarBin method for true variant likelihood (Bin1 most likely true variants, Bin 4 most likely false positive varaints). The Bin groups are displayed in four separate histograms and the total number and percentage of variants in each VarBin Bin group are shown. The corresponding GATK variant quality score recalibration scores (VQSLOD) for each of these Binned variants is plotted on the X-axis versus variant count. Note the starred (*) axis numbers, indicate that the scale is different than the other graphs in the figure. A) A variant set enriched for true variants (approximately 20,000 variants called in the study family proband chromosome one that were also found at between 10 and 20% in 1000 Genomes data set). B) A variant set enriched for false positive variants (approximately 14,500 variants called in the proband's chromosome 1 - 22 that were not found in 1000 Genomes data or in either parent).

