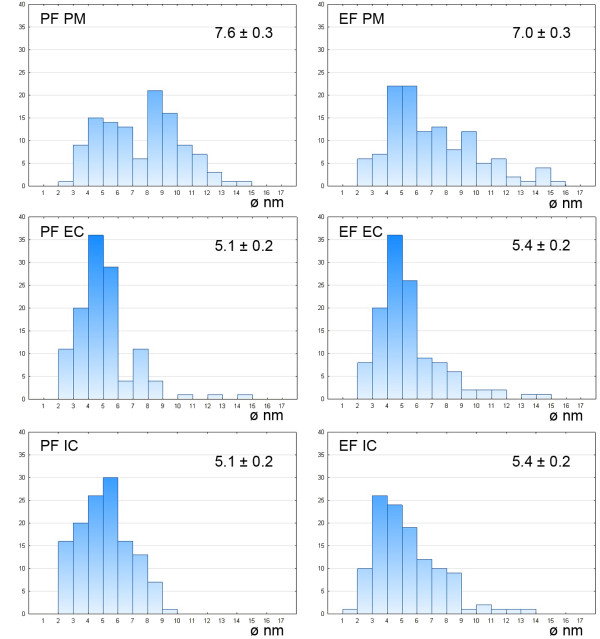
Figure 13.
Histograms illustrating the IMP size distribution in Gregarina steini; protoplasmic (PF) and exoplasmic fracture (EF) faces of the plasma membrane (PM), external cytomembrane (EC), internal cytomembrane (IC). The mean diameter (nm) of IMP, with the standard error, is given for each. Ordinate - number of particles; abscissa - particle diameter in nm.

