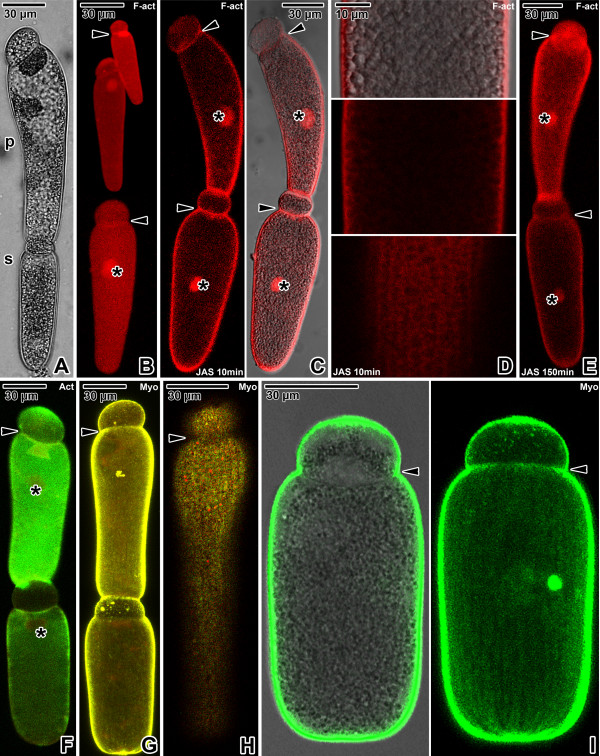
Figure 3.
Actin and myosin in Gregarina steini gamonts. A. Gamonts associated in syzygy; primite (p), satellite (s). LM, transmitted light. B. Localisation of F-actin in three single gamonts; nucleus (asterisk), septum (arrowheads). CLSM, phalloidin-TRITC. C. Localisation of F-actin in gamonts associated in syzygy treated for 10 minutes with 10 μM JAS. The intense labelling is restricted to the cortex, septum (arrowheads) and nucleus (asterisks). CLSM (left) and merged CLSM/transmitted light (right), phalloidin-TRITC. D. The deutomerite of a gamont treated for 10 minutes with 10 μM JAS. The localisation of F-actin corresponds to the cortex. Upper two figures show the gamont middle plane; lower figure is a view of the cortex in the area of epicytic folds. Merged CLSM/transmitted light (upper) and CLSM, phalloidin-TRITC. E. Localisation of F-actin in gamonts associated in syzygy treated for 150 minutes with 10 μM JAS. Note the decreased labelling of cell cortex and septum (arrowheads); nucleus (asterisks). Numerous indistinct, small cytoplasmic aggregations of F-actin give the labelling a more homogenous appearance. CLSM, phalloidin-TRITC. F. Actin localisation in gamonts associated in syzygy; nucleus (asterisks). The septum (arrowhead) exhibits an intense labelling. CLSM, IFA. G. Myosin labelling in gamonts associated in syzygy; septum (arrowhead). CLSM, IFA. H. An optical plane of the gamont cortex showing the distribution of myosin corresponding to the epicytic folds; septum area (arrowhead). CLSM, IFA. I. Myosin localisation in a single gamont. The labelling is restricted to the cortex and exhibits a pattern of longitudinal rows. A slight labelling in the septum area is shown (arrowhead). Merged CLSM/transmitted light (left) and CLSM (right), IFA. Figures F, G and H show merged FITC (antibody) and rhodamine (counterstaining with Evans blue) fluorescence channels.

